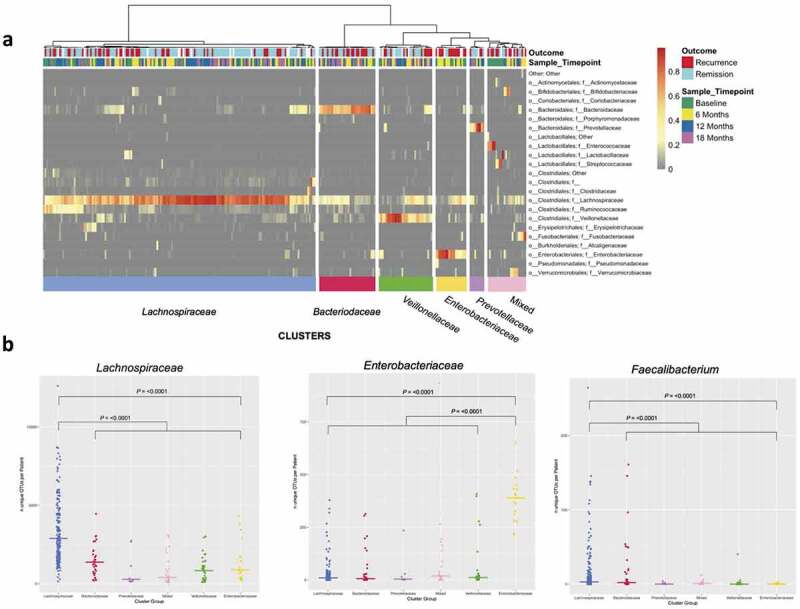
Figure 4.

Panela: Hierarchical cluster analysis showing samples partitioning into six major groups based on relative abundance at family level. Annotations below the dendrogram are outcome at 18 months (Recurrence ≥ Rutgeerts i2, Remission ≤ Rutgeerts i1) and sample timepoint. Color bars below the panel denote the cluster group, named by the respective dominating bacterial family. Panel b: Number of unique OTUs within each cluster (x-axis) for Lachnospiraceae OTUs (left) and Enterobacteriaceae OTUs (middle) at family level, and Faecalibacterium OTUs at genus level (right). Bar represents median number of OTUs per cluster group.
