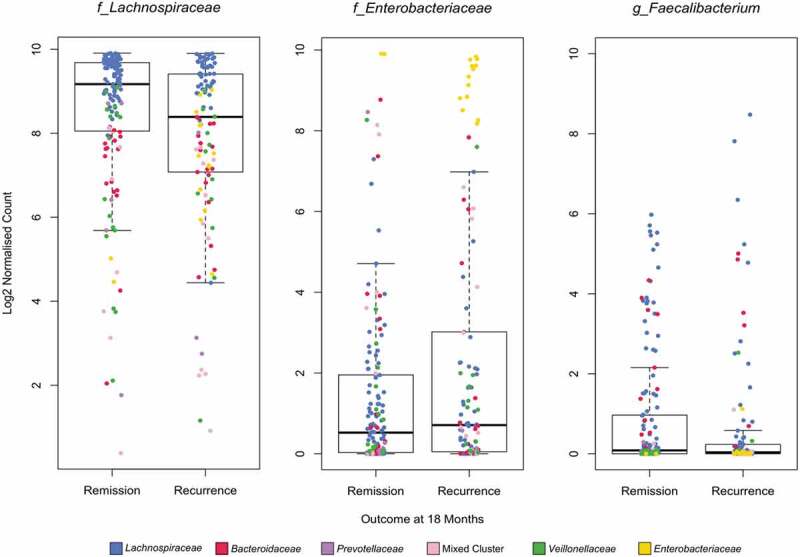
Figure 5.

Cumulative Sum Scaled (CSS) normalized Log2 relative count derived from all samples (0,6,12 and 18 months) for Lachnospiraceae, Enterobacteriaceae (family level), and Faecalibacterium (genus level) by outcome at 18 months. Individual samples are colored by cluster assignment as per legend and figure 4A.
