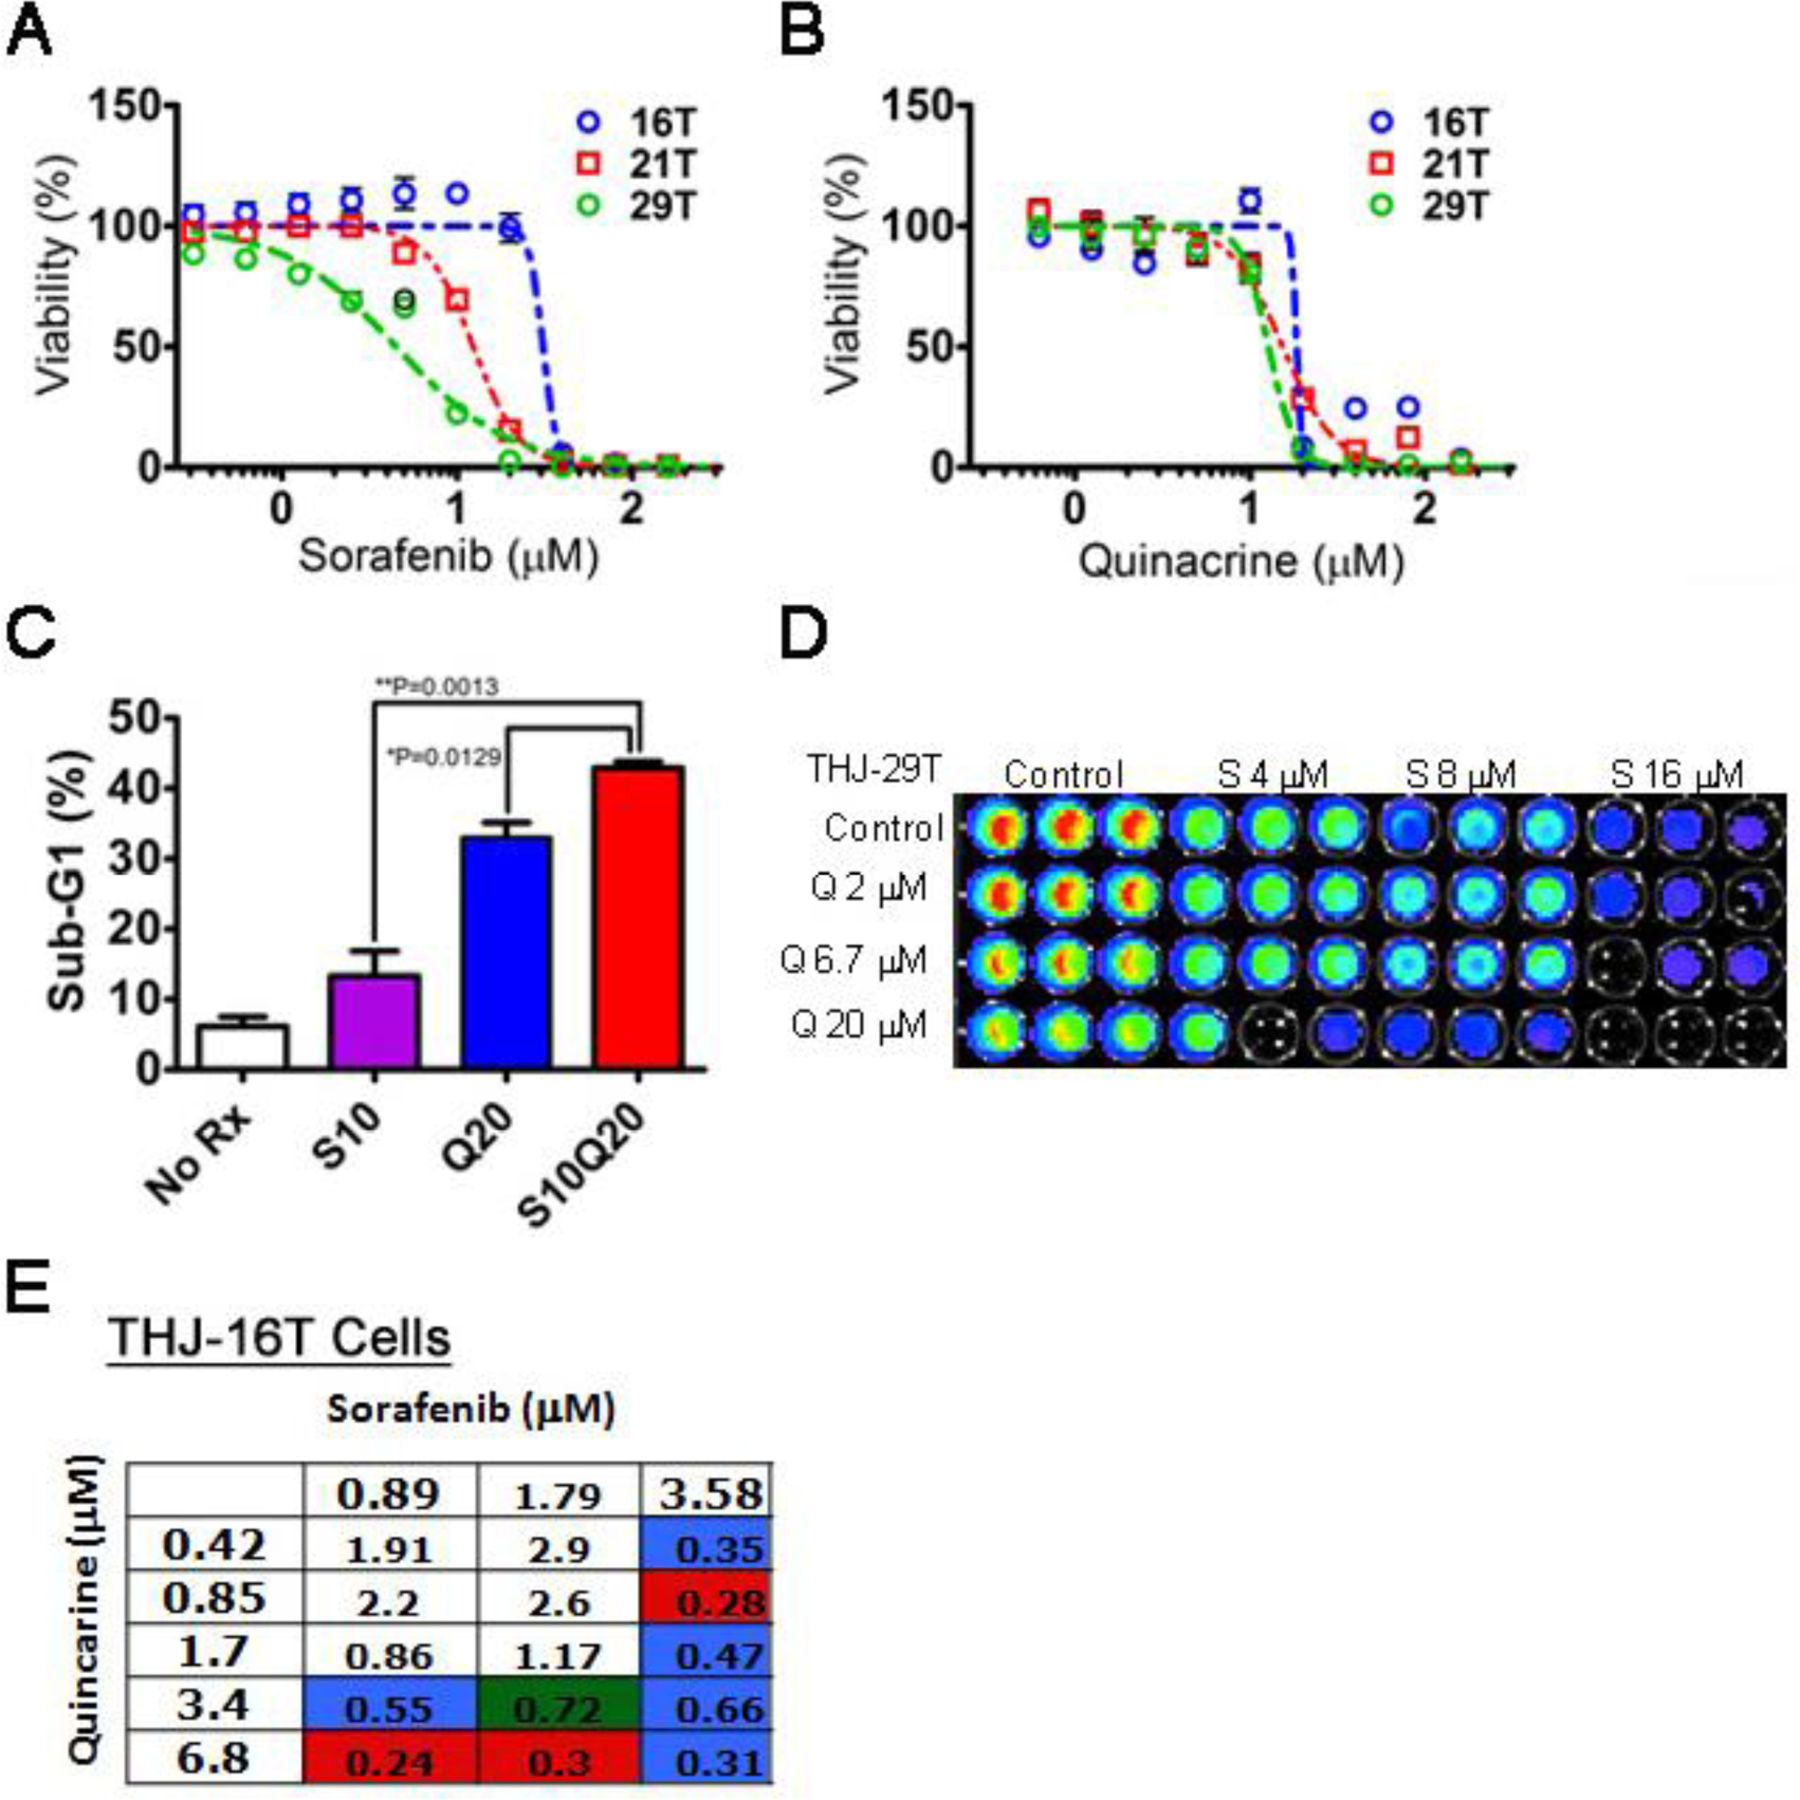
Figure 3: Quinacrine and sorafenib synergize in the killing of ATC cells.

Dose-response curves for the 72-hr survival of ATC cell lines THJ-16T, THJ-21T and THJ-29T following sorafenib (A) and quinacrine (B). The X-axis are shown as log scale. (C) Flow cytometric sub-G1 programmed cell death (apoptosis) assay of the ATC cell line 8505C subjected to treatment with sorafenib (S) and quinacrine (Q) and the combination (S/Q). Averages (N=3) +/− SEM are shown. Statistical analysis was performed using Students t-test where P<0.05 was considered statistically significant. Dose-response modulation of the combinatorial response of Q and S. (D) Cell survival assay (CellTiter-Glo®) of ATC cells treated with different combinatorial concentrations of Q and S. A representative figure of the result of a 72-hr Cell Titer-Glo® assay for the ATC cell line THJ-29T is shown. (C) Combinatorial indices generated using the CalcuSyn 2.0 software employing the method by Chou Talalay for S and Q in the sorafenib-refractory ATC cell line THJ-16T. Red indicates ‘strong drug synergism’, blue – ‘drug synergism’, green – ‘moderate drug synergism’.
