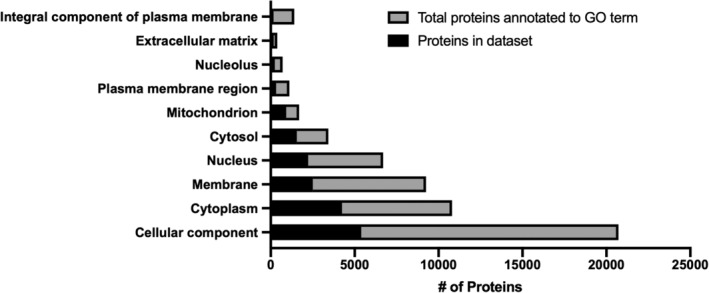
FIGURE 2.

Gene ontology (GO) cellular component enrichment for proteomics. Proteins quantified in all experimental groups (black bars) are overlaid on the total proteins annotated to a given GO term (gray bars) for various cellular components. n = 3 mice/genotype and age combination (2 mo WT, 2 mo KO, 6 mo WT, 6 mo KO)
