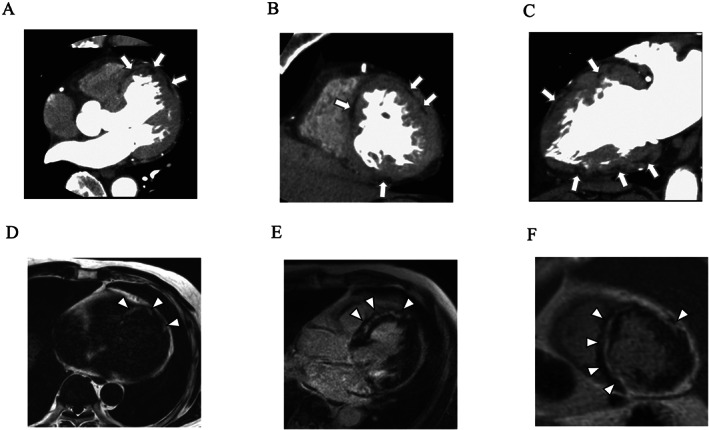
FIGURE 2.

Cardiac computed tomography images: (A) axial image, (B) short‐axis image, and (C) vertical long‐axis image. Arrows indicate fat densities. Cardiac magnetic resonance imaging images: (D) fat‐selective image with mDIXON sequence (axial image), (E) late gadolinium enhancement (LGE) image (horizontal long‐axis image), and (F) LGE image (short‐axis image). Arrowheads indicate fat signals in (D) and LGEs in (E) and (F).
