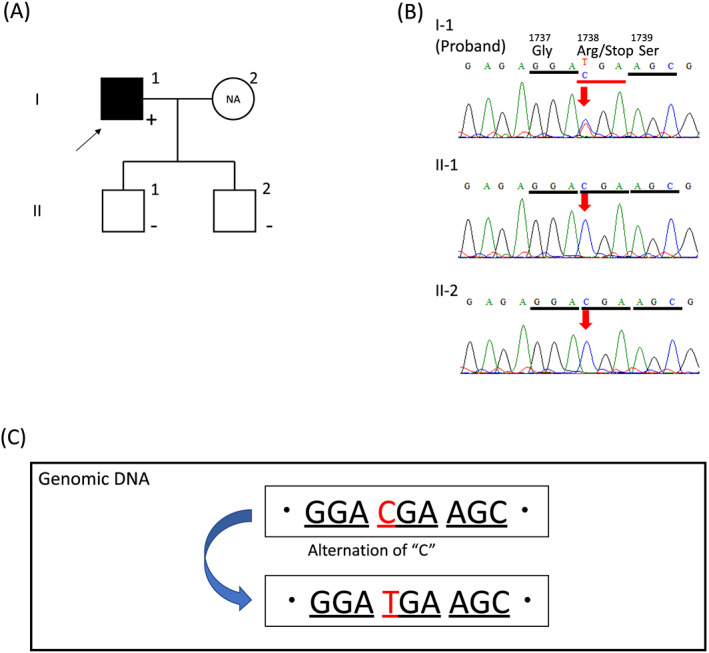
FIGURE 4.

Genetic analyses of the family. (A) Family tree shows an affected proband (filled square) and asymptomatic sons (open squares). Plus sign (+), mutation positive; negative sign (−), mutation negative; NA, not available. (B) Electropherogram of the sequencing analysis. A T to C substitution at nucleotide 5212 caused a nonsense mutation at codon 1738 in the sequence of the proband (I‐1), with no substitution in those of II‐1 and II‐2. Panel (C) indicates the c.5212C > T, p.R1738* mutation. (···GGACGAAGC··) instead of the normal subject data (···GGATGAAGC···).
