FIGURE 2.

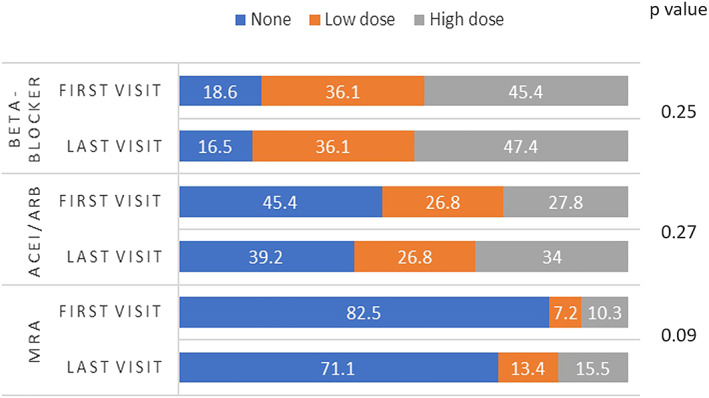
Comparison of proportions of patients in different medication dosage groups (none, low dose, and high dose) between the first and last visit

Comparison of proportions of patients in different medication dosage groups (none, low dose, and high dose) between the first and last visit