
Figure 1.
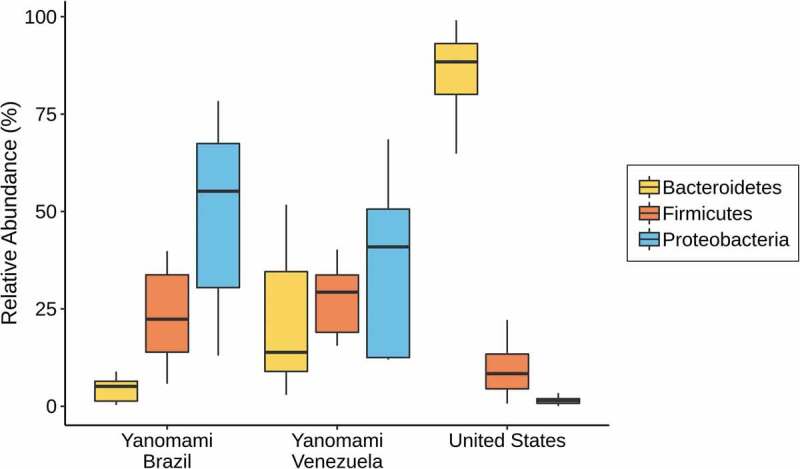
Boxplot showing the relative abundance of the main phyla identified in each group studied: Bacteroidetes, Firmicutes and Proteobacteria. The Yanomami present high Proteobacteria and higher Firmicutes to Bacteroidetes ratio as Bosman et al’s group exposed to UVB light. This graph was generated based on the relative abundance of the main phyla identified by Kraken in the metagenomes of Yanomami and USA groups, as described in Conteville et al, 2019.14