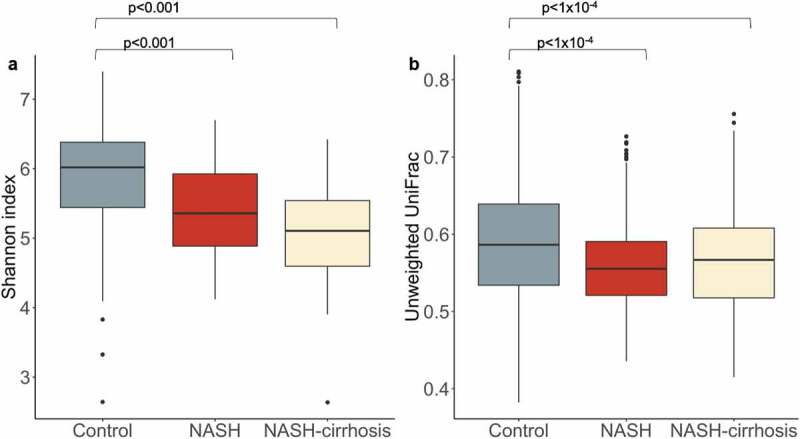
Figure 1.

Diversity metrics in control, NASH, and NASH-cirrhosis groups. A: Alpha diversity measured using the Shannon index, B: Beta diversity measured using Unweighted UniFrac distances between all samples in each group. Diversity indices were calculated using the OTU table rarefied to 7000 sequences per sample 50 times and taking the average.
