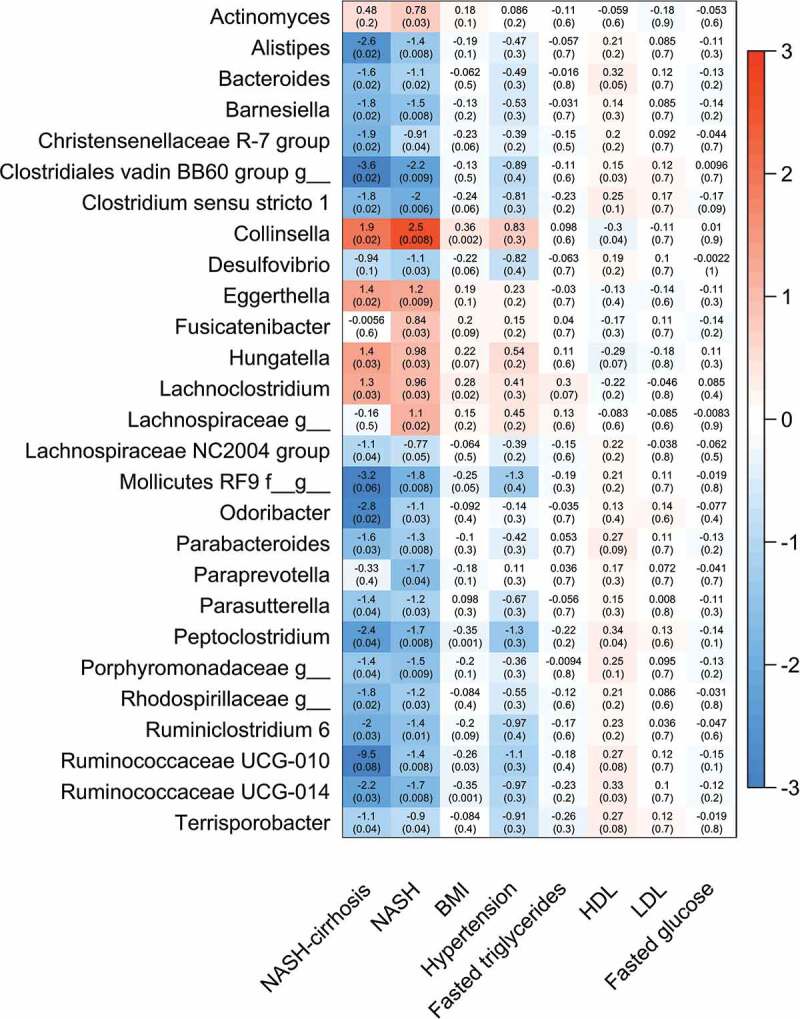
Figure 2.

Heat map showing all OTUs (clustered at genus level) significantly associated with NASH or the control group and association with presence of NASH, NASH-cirrhosis, BMI, hypertension, total fasted triglycerides (TG), high-density lipoprotein (HDL), low-density lipoprotein (LDL) and fasted glucose. Values are beta coefficients from linear models adjusted for BMI, age and gender (associations between genera and BMI are adjusted for age and gender only). P values shown in parentheses are adjusted for FDR.
