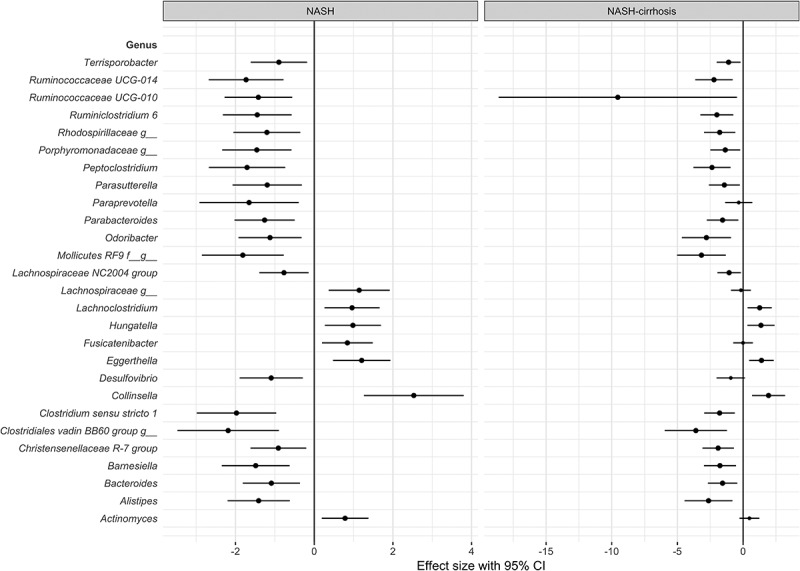
Figure 3.

Forest plot of effect sizes with 95% confidence intervals showing association of all significant (FDR adjusted p < .05) OTUs with NASH and NASH-cirrhosis compared to control cohort. Smaller dots on the NASH-cirrhosis arm indicate a loss of statistical significance.
