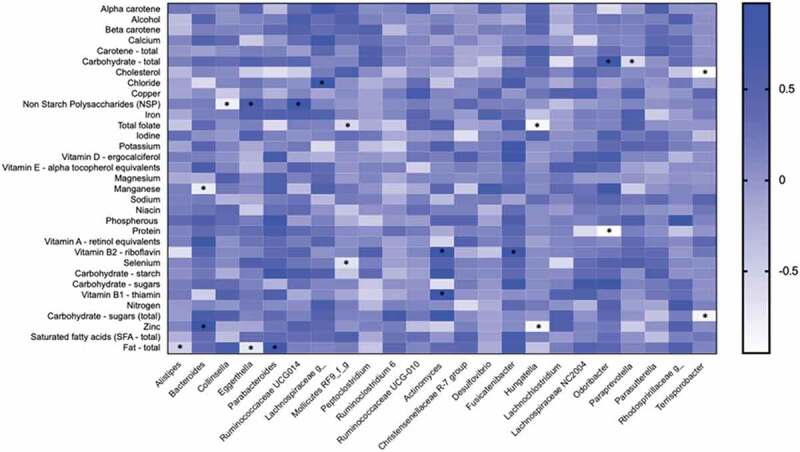
Figure 5.

Heatmap depicting the correlation between the abundance of genera significantly associated with NASH and NASH-cirrhosis and dietary components. The intensity of the color represents the degree of association between bacterial abundances and nutrients as measured by Spearman’s correlations. The asterisk symbols indicate the associations that are significant after adjusting for FDR.
