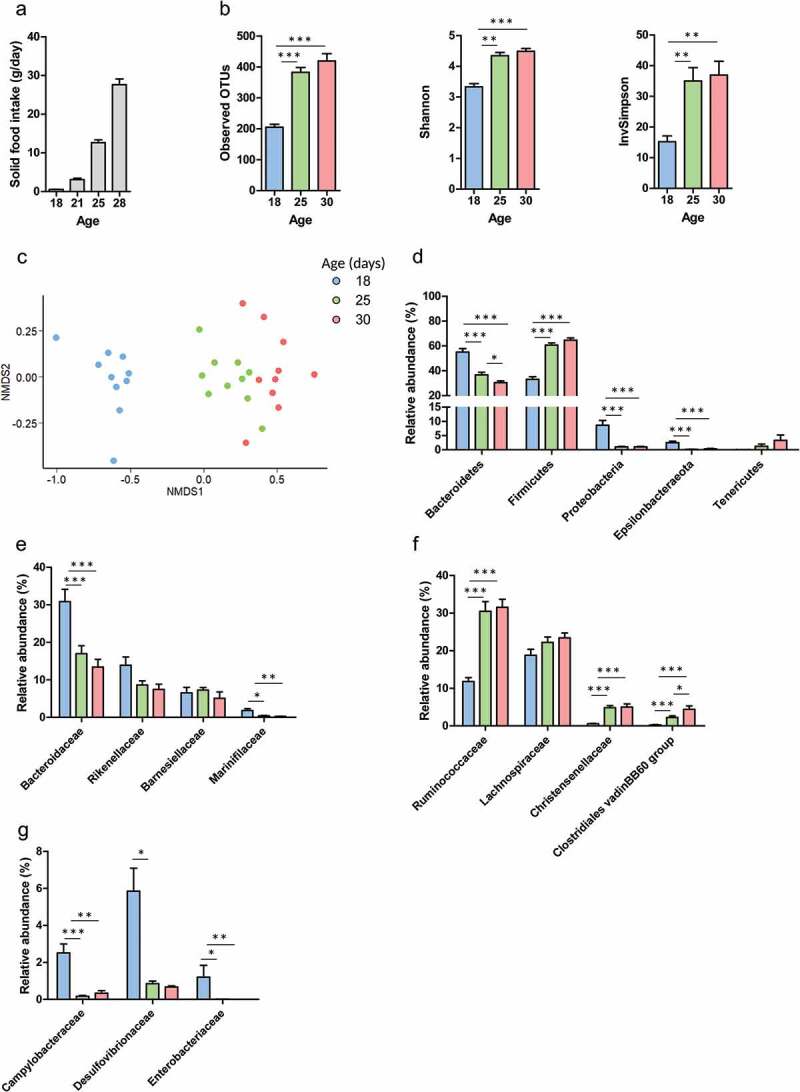
Figure 1.

The microbiota composition shifts at the onset of solid food ingestion. (a): Solid food intake by rabbit pups per day. The microbiota composition was analyzed by 16S rRNA amplicons sequencing in cecal content of rabbits at postnatal day 18, 25 and 30. (b): α-diversity indices. (c): Non Metric Dimensional Scaling (nMDS) two-dimensional representation of the microbiota β-diversity using Bray Curtis distance calculation (stress = 11.29). (d): Relative abundance of the main phyla. (e–g): Relative abundance of families in the phylum Bacteroidetes (e), Firmicutes (f), Proteobacteria and Epsilonbacteraeota (g). Data are presented as means ± SEM, n = 10/group. Kruskal-Wallis test was used to analyze age effect, followed by pairwise Wilcoxon test to compare the mean values of each group. *: P < .05, **: P < .01, ***: P < .001.
