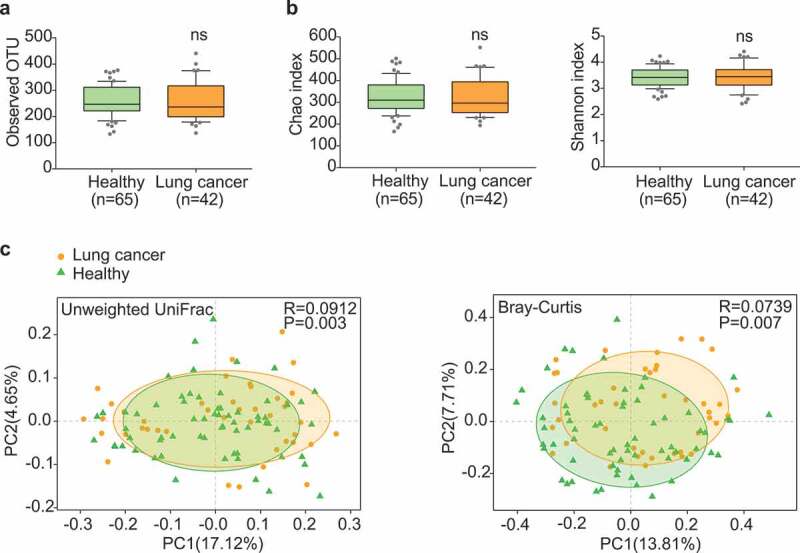
Figure 1.

Gut microbiota dysbiosis in lung cancer patients. (a) Numbers of OTUs observed in patients and healthy controls. (b) Microbial richness based on the Chao index and diversity based on the Shannon index. The box represented the interquartile range (IQR) between the first and the third quartiles, and the midline represented the median. Whiskers extended to values within 1.5 times IQR. Circles indicated outliers beyond the whiskers. (c) Principal coordinates analysis (PCoA) for lung cancer (orange) and healthy control samples (green). Left, Unweighted UniFrac; right, Bray–Curtis. Significant differences were observed between patients and healthy controls with ANOSIM test (UniFrac, R = 0.0912, P = .003; Bray–Curtis, R = 0.0739, P = .007). The first two principal coordinates (PCs) were each labeled with the percentage of variance explained.
