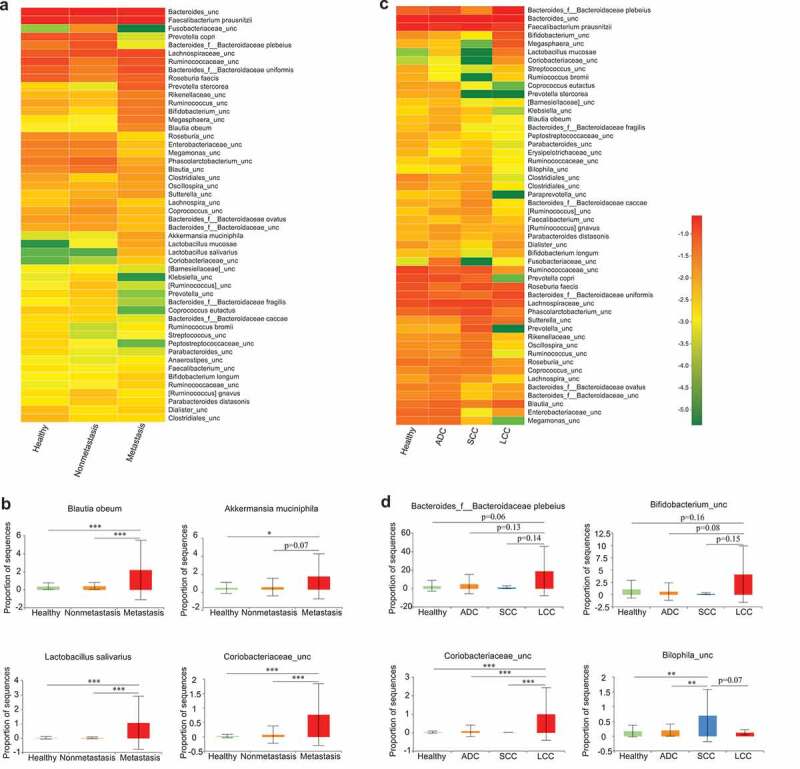
Figure 3.

Association between clinical variables and gut microbiota abundance. Heat map showing the relative abundances of the 50 most abundant species in samples grouped by metastatic status (a) and lung cancer subtypes (c), respectively. Species were in rows, and the relative abundance was indicated by color gradient. The most significantly changed species were further analyzed in each group (b, d). Description of boxplots was the same as in Figure 1. Two-tailed Wilcoxon rank-sum test, *p < .05, **p < .01, ***p < .001.
