
Figure 2.
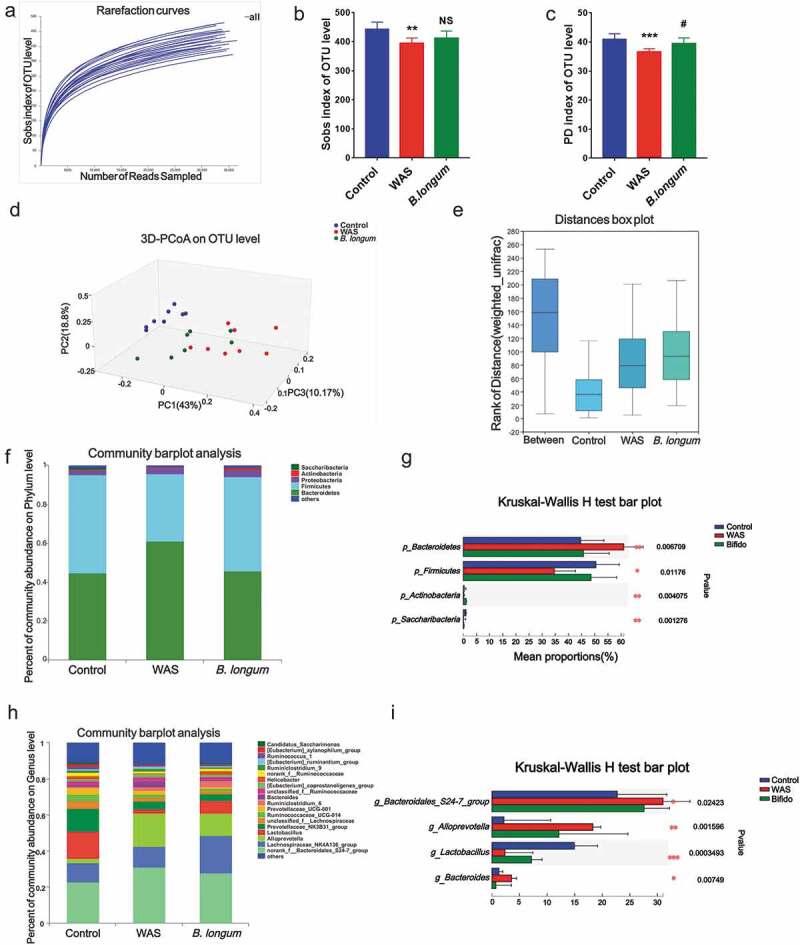
Alterations in the composition and diversity of the intestinal microbiota in water avoidance stress (WAS) rats following B. longum administration. (a) The rarefaction curve at the operational taxonomic unit (OTU) level showed a plateau and saturation phase, indicating that the sample size was sufficient to capture the overall microbiota structure. (b, c) The Sobs index (b) and phylogenetic diversity (PD) index (c) of the three groups at the OTU level. (d, e) β-Diversity was calculated by principal co-ordinate analysis (PCoA) (d) and analysis of similarities (ANOSIM) (e) at the OTU level based on weighted unifrac analysis, indicating the different fecal microbiota structure among the three groups (weighted unifrac, ANOSIM r = 0.5992, p = .001). (f, g) Relative abundance of the gut microbiota at the phylum level (f) and the top 4 of them with significant differences (g) among the three groups. (h, i) Relative abundance of microbiota at the genus level (h) and the top 4 microbiota of them with significant differences among the three groups (i). Data are shown as the mean ± SD, *, p < .05, **, p < .01, **, p < .001 WAS vs Ctrl and #, p < .05 B. longum vs WAS, n = 8.