
Figure 3.
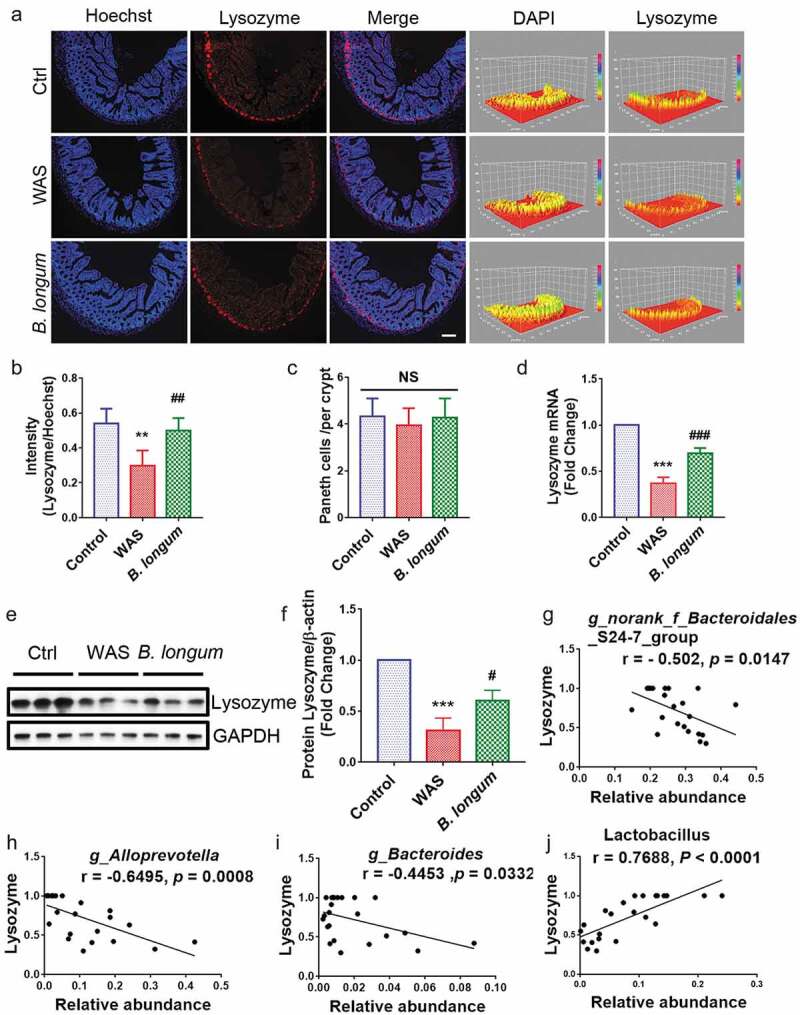
Bifidobacterium longum (B.longum) enhanced lysozyme expression in Paneth cells. (a) Representative images of ileal sections of rats from health control group (Ctrl), water avoidance stress (WAS) treatment group (WAS), and group subjected to WAS treatment followed by administration of B. longum for 10 days (B. longum). Cell nuclei in the sections were stained using DAPI (blue) and lysozyme was stained with an anti-lysozyme antibody (red). The intensity of the cell nucleus and lysozyme was quantified with Image J software. Scale bar = 100 μm. (b) Expression of lysozyme in the rat ileum was determined by quantifying the relative intensity of lysozyme/DAPI fluorescence from an average of 5 sections per rat of 5 rats from each group using blind examination by independent readers. Data are shown as the mean ± SD, **, p = .0014 of Ctrl vs WAS, ##, p = .0052 of B. longum vs WAS. (c) Analysis of the number of Paneth cells per crypt from an average of 5 well-preserved crypts per slide and of 5 rats from each group. Data are shown as the mean ± SD, p = .3191 of Ctrl vs WAS, #, p = .4405 of B. longum vs WAS. (d) Relative expression of lysozyme mRNA of ileal tissue from Ctrl, WAS, and B. longum rats were quantified by QPCR. Data are shown as the mean ± SD, ***, p < .0001 of Ctrl vs WAS, ###, p = .0005 of B. longum vs WAS, n = 3. (E, F.) Western blot analysis of lysozyme protein expression in ileal tissue of 3 representative individual rats from each group. Data are shown as the mean ± SD, ***, p = .0002 of Ctrl vs WAS, #, p = .0190 of B. longum vs WAS, n = 3.(g–j) Correlation of antibacterial peptide Lysozyme mRNA expression with intestinal microbiome g _ Bacteroidales _ S24-7-group (g), g _ Alloprevotella (h), g _ Bacteroides (i), and g _ Lactobacillus (j). Data are shown as the mean ± SD.