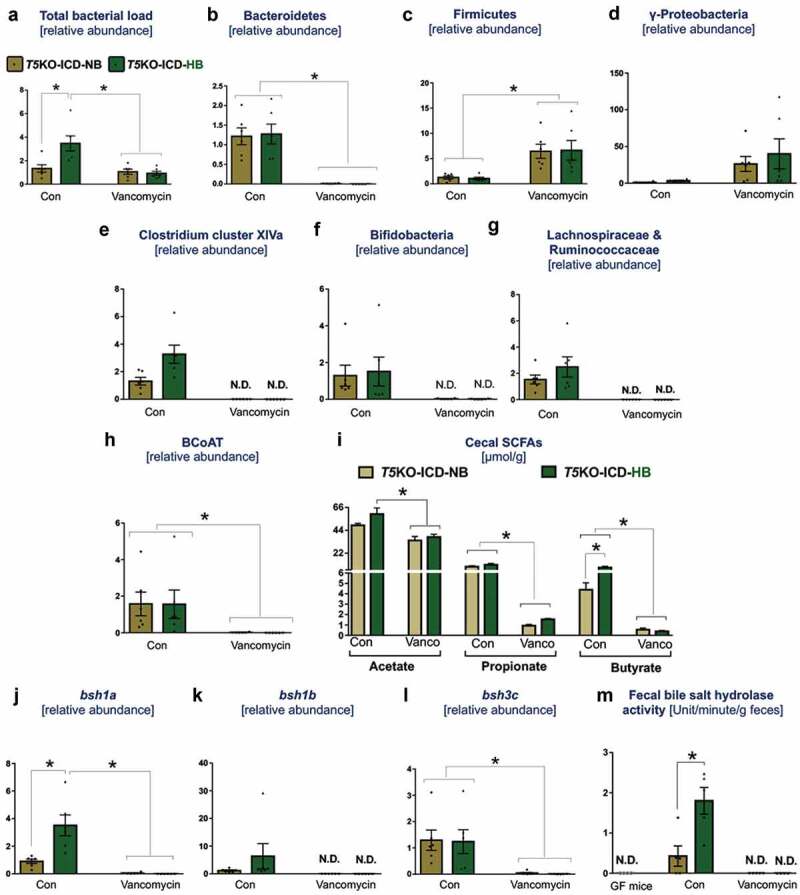
Figure 3.

Vancomycin suppresses secondary bile acid and SCFAs producers in inulin-fed mice. Bar graphs represent relative abundances of (a) total bacteria, (b) Bacteroidetes, (c) Firmicutes, (d) γ-Proteobacteria, (e) Clostridium cluster XIVa, (f) Bifidobacteria, (g) Lachnospiraceae and Ruminococcaceae. (h) Relative level of butyryl-coenzyme A (CoA) transferase (BCoAT). SCFAs were quantified in cecal content via 1 H NMR spectroscopy. (i) Bar diagram represents the level of SCFAs in cecal content. Relative gene expression of bile salt hydrolases (j) bsh1a, (k) bsh1b, and (l) bsh3 c. (m) Bile salt hydrolase (BSH) activity was measured in feces from indicated group of mice. Germ-free mice feces were used as negative control. BSH activity is expressed as mM of taurine released from the taurocholate per minute per g of feces. N.D. denotes not detected. Data are representative of six mice per group. Error bars indicate mean ± SEM. ANOVA, *p < .05.
