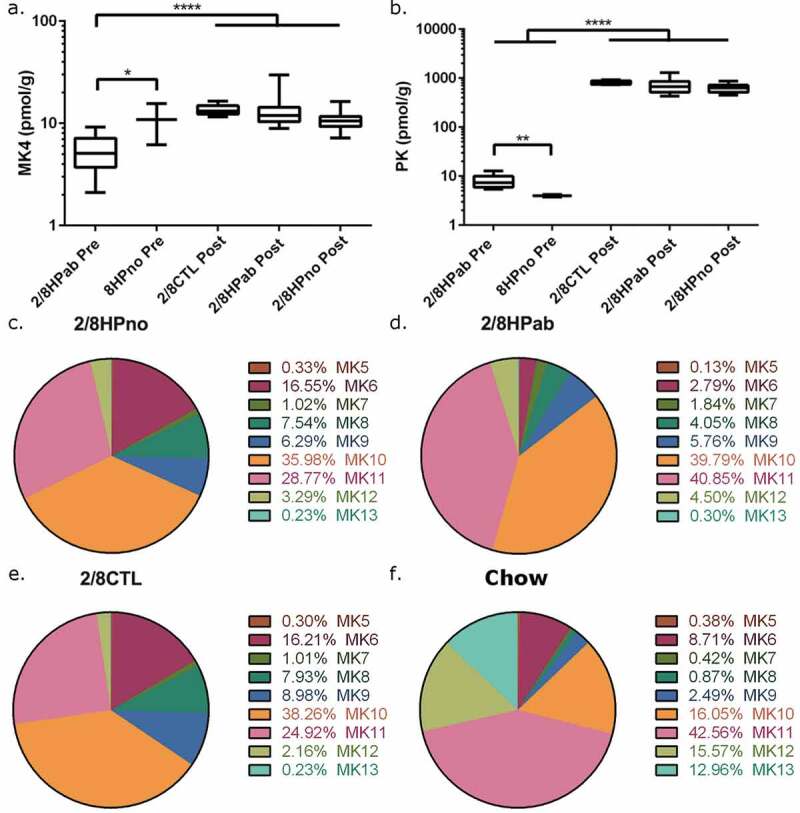
Figure 4.

Effects of antibiotic treatment in vitamin K levels in the liver and feces. (a) Liver MK4 and (b) liver PK levels were measured PRE-PK and POST-PK supplementation. For PRE-PK mice, 2/8HPab (n = 10) and 8HPno (n = 2). For POST-PK mice, 2/8CTL (n = 8), 2/8HPab (n = 17) and 2/8Hpno (n = 21). *P ≤ .05, **P ≤ .01, ***P ≤ .001, ****P ≤ .0001. (c-f) The relative abundance of fecal MKn prior to PK supplementation in (c) antibiotic-free, H. pylori-infected (2/8HPno), (d) antibiotic-treated, H. pylori-infected (2/8HPab), (e) uninfected mice on the AAD diet (2/8CTL), and (f) uninfected mice on standard rodent chow (Chow).
