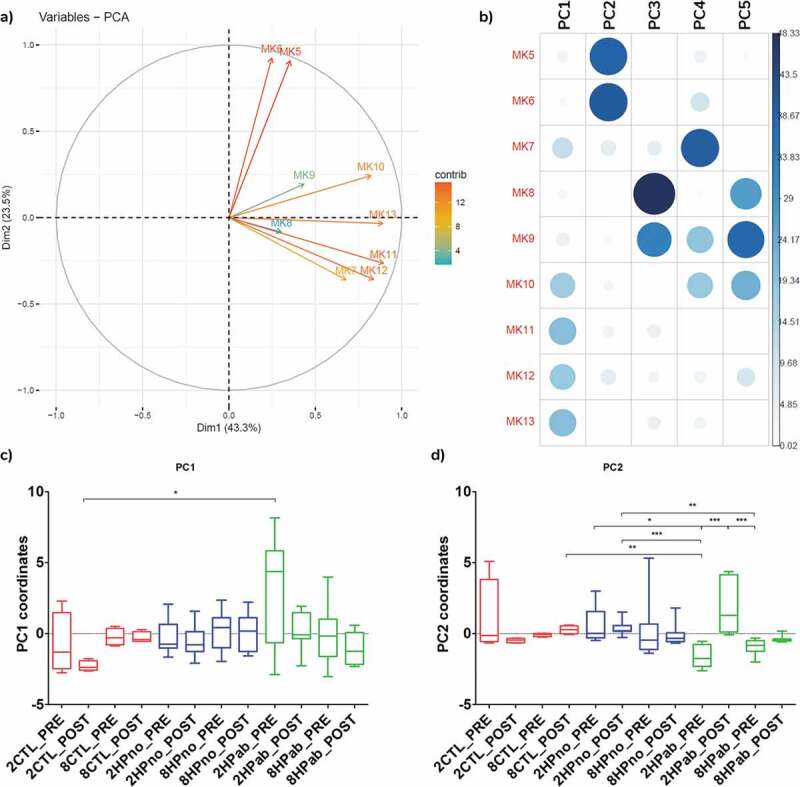
Figure 8.

Principal component analysis of fecal menaquinones associates MK5-6 with antibiotic treatment. (a) PCA of MKn data. (b) Contribution of each MKn to principal components (PC) shows PC2 is associated with MK5-6. (c) Boxplots of PC1 coordinates by treatment group. d) Boxplots of PC2 coordinate by treatment group. Negative PC2 values for PRE-PK antibiotic-treated mice (2HPab_PRE and 8HPab_PRE) indicate an inverse correlation with MK5-6 values. *p < .05, **p < .01, and ***p < .001.
