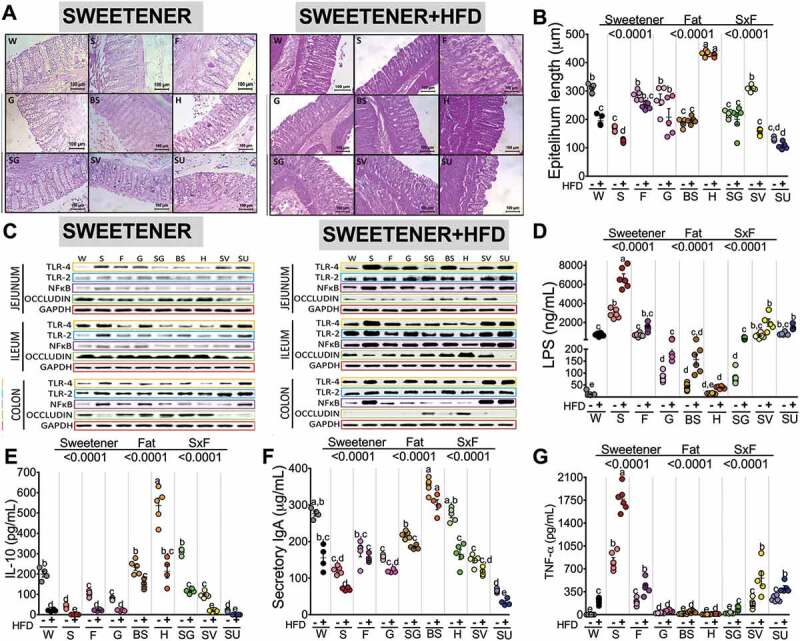
Figure 4.

Effect of type of sweetener and the dietary fat content on the epithelium barrier and the inflammatory pathway. (a) Colon histological morphology by hematoxylin-eosin staining, (b) Epithelium layer quantitative analysis, (c) Western blot analysis of TLR4, TLR2, NFκB and occludin in the intestine (d) Serum LPS concentrations, (e) Serum IL-10 concentrations, (f) Serum sIgA concentrations and (g) Serum TNF-α concentrations after the consumption of different types of sweeteners with or without a high-fat diet. The raw data and means±SEMs are shown in each plot, n = 6–7 in each group. W = water, S = sucrose, F = fructose, G = glucose, SG = steviol glycosides, BS = brown sugar, H = honey, SV = steviol glycosides+sucrose and SU = sucralose.
