
Figure 6.
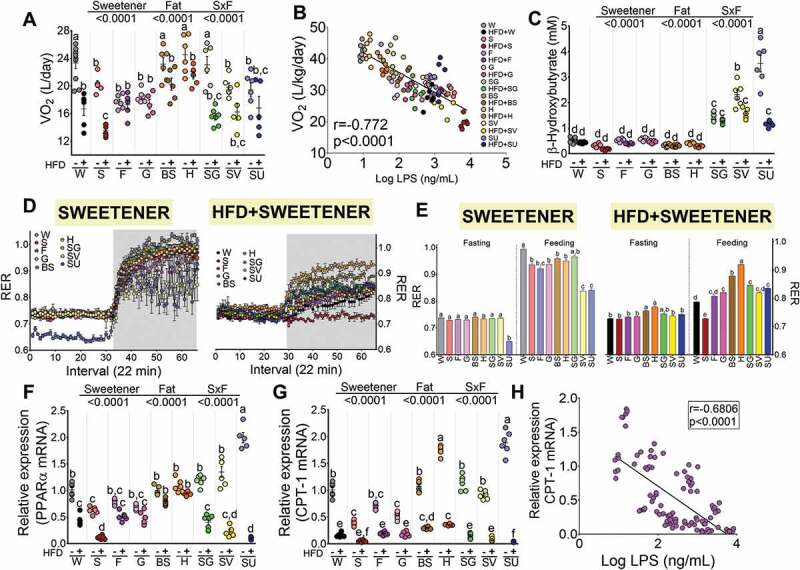
Energy expenditure and fatty acid oxidation depends on the type of sweetener and the high-fat diet. (a) O2 consumption (VO2 expressed as L/day corrected for body mass by ANCOVA), (b) Correlation between oxygen consumption and serum LPS levels, (c) Liver PPARα gene expression, (d) Liver CPT-1 gene expression, (e) Correlation between CPT-1 expression and serum LPS concentration, (f) Serum β-hydroxybutyrate concentration after the consumption of different types of sweeteners with or without high-fat diet, (g, h) Respiratory exchange ratio (RER) after the consumption of different types of sweeteners with or without a high-fat diet. Data are shown as the mean±SEM, n = 6–7 in each group. W = water, S = sucrose, F = fructose, G = glucose, SG = steviol glycosides, BS = brown sugar, H = honey, SV = steviol glycosides+sucrose and SU = sucralose.