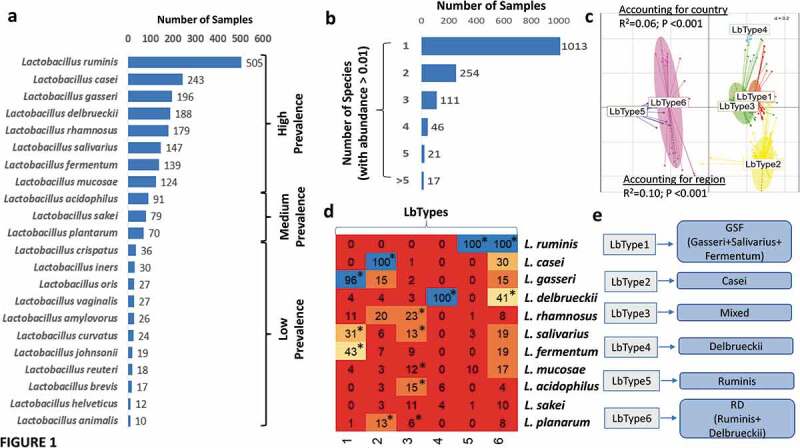
Figure 1.

The gut microbiome of apparently healthy individuals is characterized by distinct lactobacillus populations. a. Bar plots showing the number of times each Lactobacillus species was detected (with abundance > 0.01%) in samples from ‘non-diseased’ control individuals. The species belonging to the ‘High-Prevalence’, ‘Medium-Prevalence’ and ‘Low-Prevalence’ groups of lactobacilli are demarcated. b. Bar showing the number of control individuals having different number of Lactobacillus species in their gut microbiomes. c. Principal Component Analysis (PCoA) plots (with the top 2 PCoA axes) showing the samples belonging to the different Lactobacillotypes (LbType). R-Squared and P-values of the PERMANOVA analysis testing the significance of these splits after considering both the country and the region as confounders is indicated. d. Heatmap on the left panel shows the percentage occurrence of each High and Medium prevalent Lactobacillus species in the six LbType. The percentage occurrence is the calculated from the number of times a given species was detected in a sample belonging to the given LbType divided by the total number of samples belonging to the LbType. Species that are significantly enriched in certain LbType were identified using Fishers’ Exact Test (estimate > 1 and p-value < 0.05) are indicated with *. e. Based on the significant enrichment patterns, the six LbTypes were named as described based on the dominant species in each cluster.
