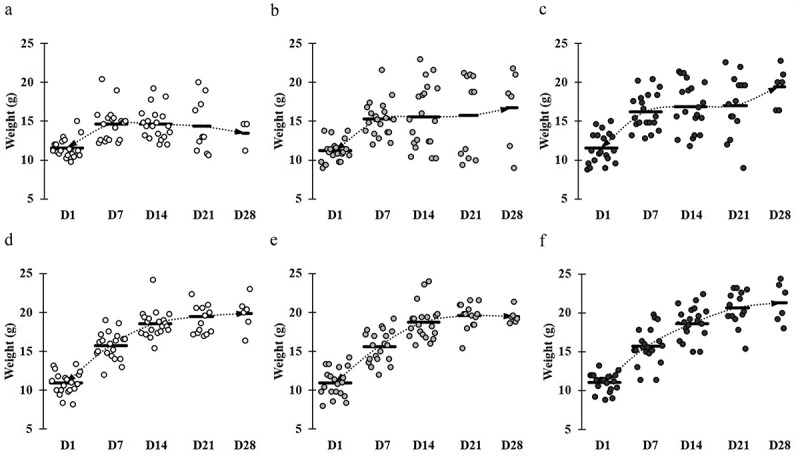
Figure 1.

Comparative weight gain and loss in mice across different groups. Mice groups were assigned with the following manner: (a) ST infection, (b) ST infection and LC 1-week pretreatment, (c) ST infection and LC+mcra 1-week pretreatment, (d) EHEC infection, (e) EHEC infection and LC 1-week pretreatment, and (f) EHEC infection and LC+mcra 1-week pretreatment. Each dot indicates individual mouse weight and horizontal bars at each time point indicate averaged weight of mice in accordant group.
