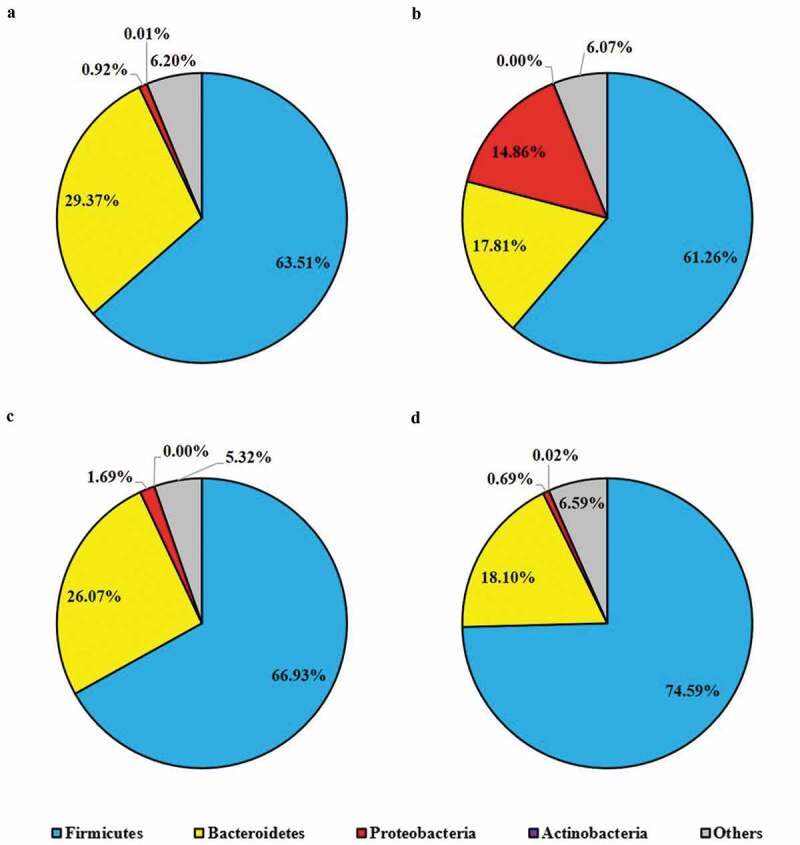
Figure 8.

Mice cecal microbial community phylum-level structure. Bacterial distributions at phylum level in cecal contents from individual pooled dataset were depicted in terms of (a) control mice providing placebo and without ST infection, (b) mice infected with ST, (c) mice daily administered with LC for one week followed by ST challenge, and (d) mice daily administered with LC+mcra for one week followed by ST challenge.
