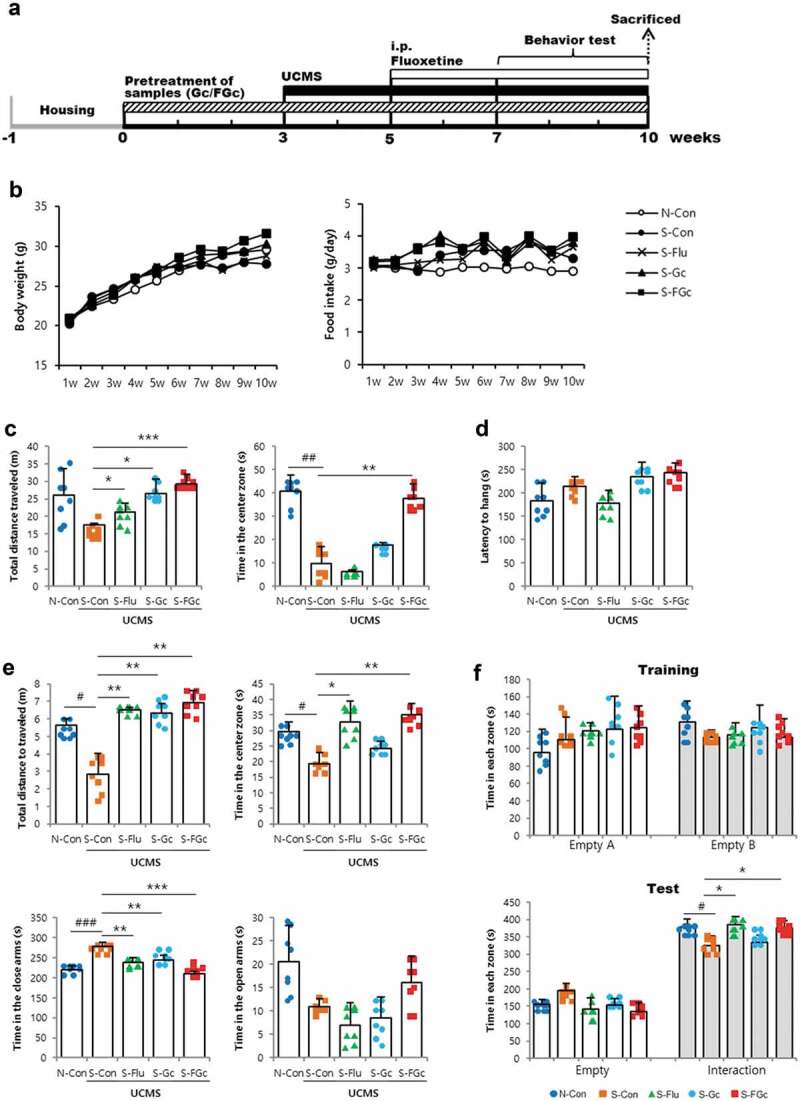
Figure 1.

(A) Schematic overview of the in vivo experiment, (B) changes of body weight, food intake, and depressive-like behaviors of mice under UCMS. (C) open-field test, (D) rotarod test, (E) elevated-plus maze test, and (F) social-interaction test. Data are expressed as mean ± SD (n = 8). #Significant difference between N-Con and S-Con (#P < .05, ##P < .005, ###P < .001). *Significant difference with S-Con (*P < .05, **P < .005, ***P < .001).
