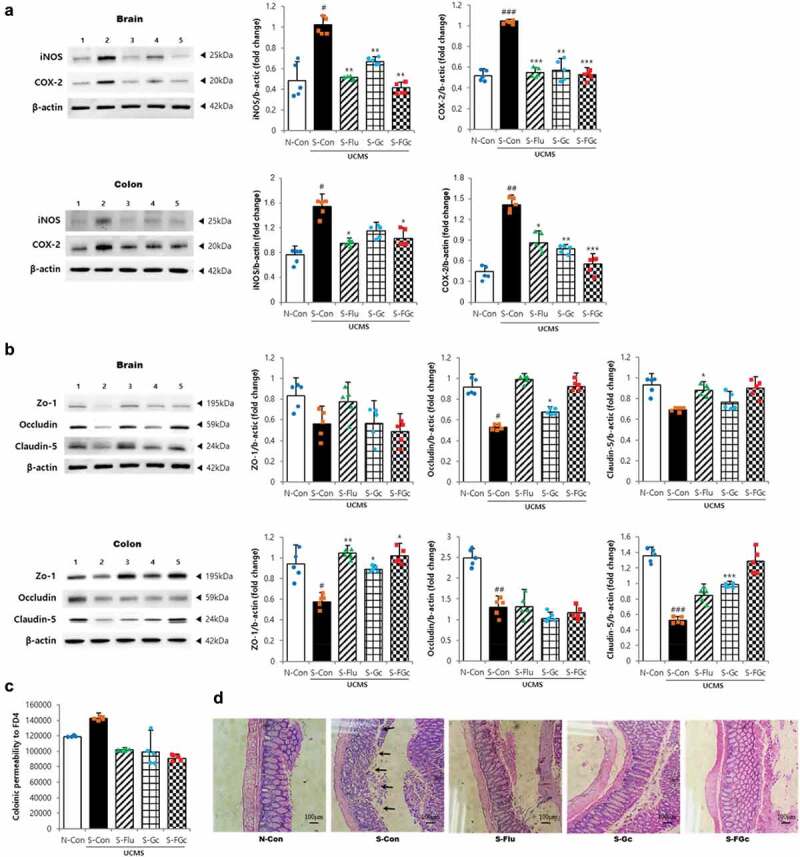
Figure 4.

Effects of Gc and FGc on inflammation and barrier function of mice brain and colon under UCMS. (A) Expression of proteins related to inflammation by western blot. Lane 1 = N-Con; lane 2 = S-Con; lane 3 = S-Flu; lane 4 = S-Gc; lane 5 = S-FGc. (B) Expression of proteins related to tight junction by western blot. Lane 1 = N-Con; lane 2 = S-Con; lane 3 = S-Flu; lane 4 = S-Gc; lane 5 = S-FGc. (C) Intestinal epithelial permeability to FD4. (D) Representative H&E stained colon sections. Arrows indicate depleted epithelial cells. Data are expressed as mean ± SD (n = 5). #Significant difference between N-Con and S-Con (#P < .05, ##P < .005, ###P < .001). *Significant difference with S-Con (*P < .05, **P < .005, ***P < .001).
