Figure 6.

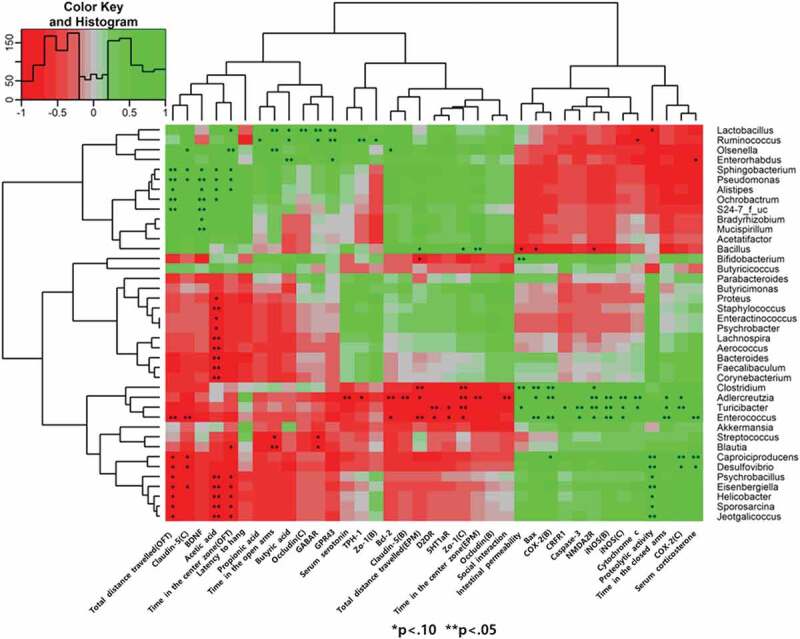
Heat map showing the correlation coefficients between the selected genera and stress-induced dysregulated markers. Red and green colors indicate positive and negative correlations, respectively. An asterisk indicates *P < .1, **P < .05.

Heat map showing the correlation coefficients between the selected genera and stress-induced dysregulated markers. Red and green colors indicate positive and negative correlations, respectively. An asterisk indicates *P < .1, **P < .05.