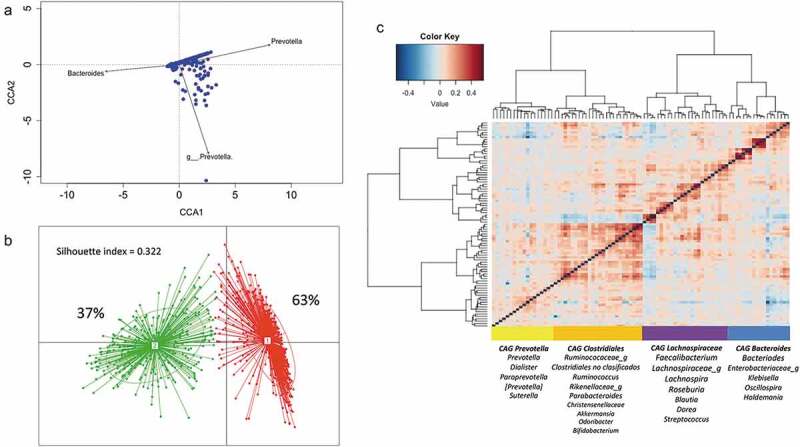
Figure 2.

Structure and variation of microbial community in 926 participants of the ORSMEC cohort. (a) Top genera contributing to microbial community variation within the dataset as assessed by canonical correspondence analysis. (b) Clustering of the 926 participants based on genera composition data and using the JSD and PAM clustering. The optimal number of clusters was chosen by the Calinski–Harabasz index and validated based on the prediction strength and average silhouette width (SW). (c) Hierarchical Ward-linkage clustering based on Kendall correlation coefficients of the relative abundance of genera present in at least 25% of the samples. Co-abundance groups (CAGs) were defined based on the clusters in the vertical tree and named after their most representative taxon.
