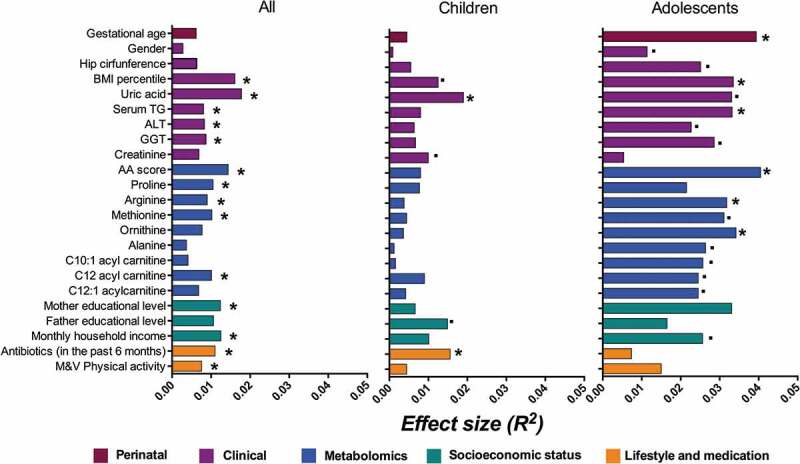
Figure 4.

Explained variance of selected microbiome covariates. Horizontal bars show the amount of variance (R2) explained by each covariate in the model as determined by EnvFit function in R. The rest of the covariates and the groups within are detailed in Supplementary Table 3. Covariates are colored based on the overall metadata group. Asterisk denotes significant covariates [false discovery rate (FDR) P < 0.10] while dot denotes significant covariates in each age group before FDR correction (P < 0.05).
