
Figure 4.
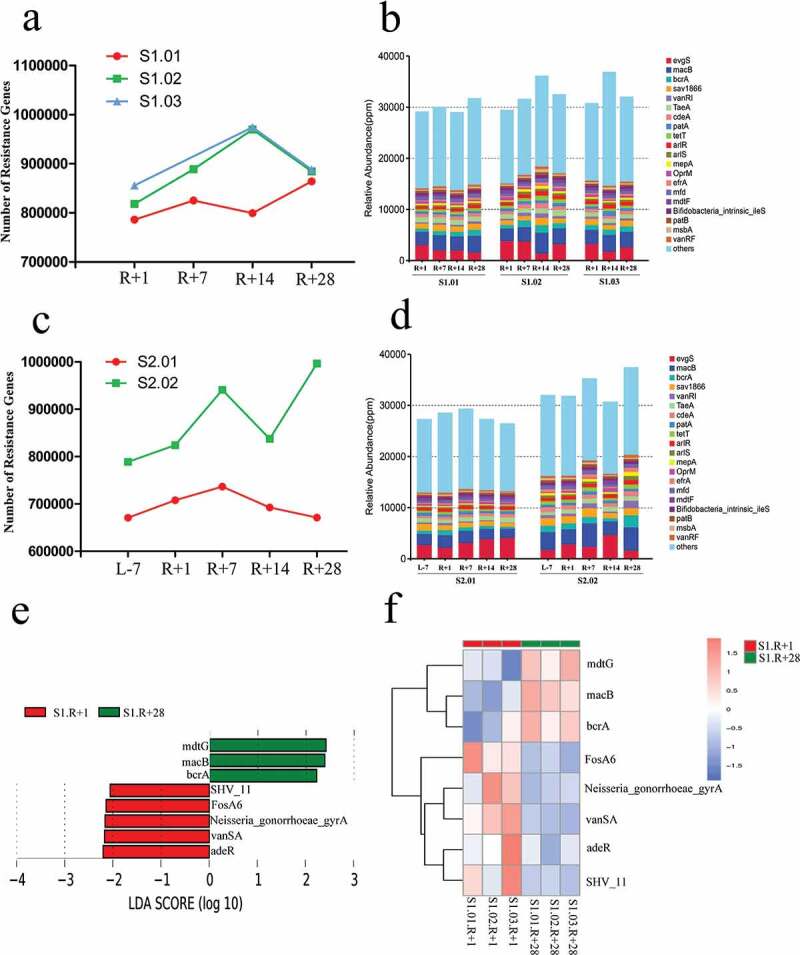
Resistance genes and antibiotic resistance ontologies (AROs) affected by spaceflight in missions one and two; the ARO is the core composition of the CARD database. (a) Total number of resistance genes affected by spaceflight in mission one. (b) Relative abundance of the top 20 AROs affected by spaceflight in mission one. (c) Total number of resistance genes affected by spaceflight in mission two. (d) Relative abundance of the top 20 AROs affected by spaceflight in mission two. (e) Distribution diagram of the AROs; the LDA score of the top 2 AROs is shown. (f) Cluster heat map based on different AROs.