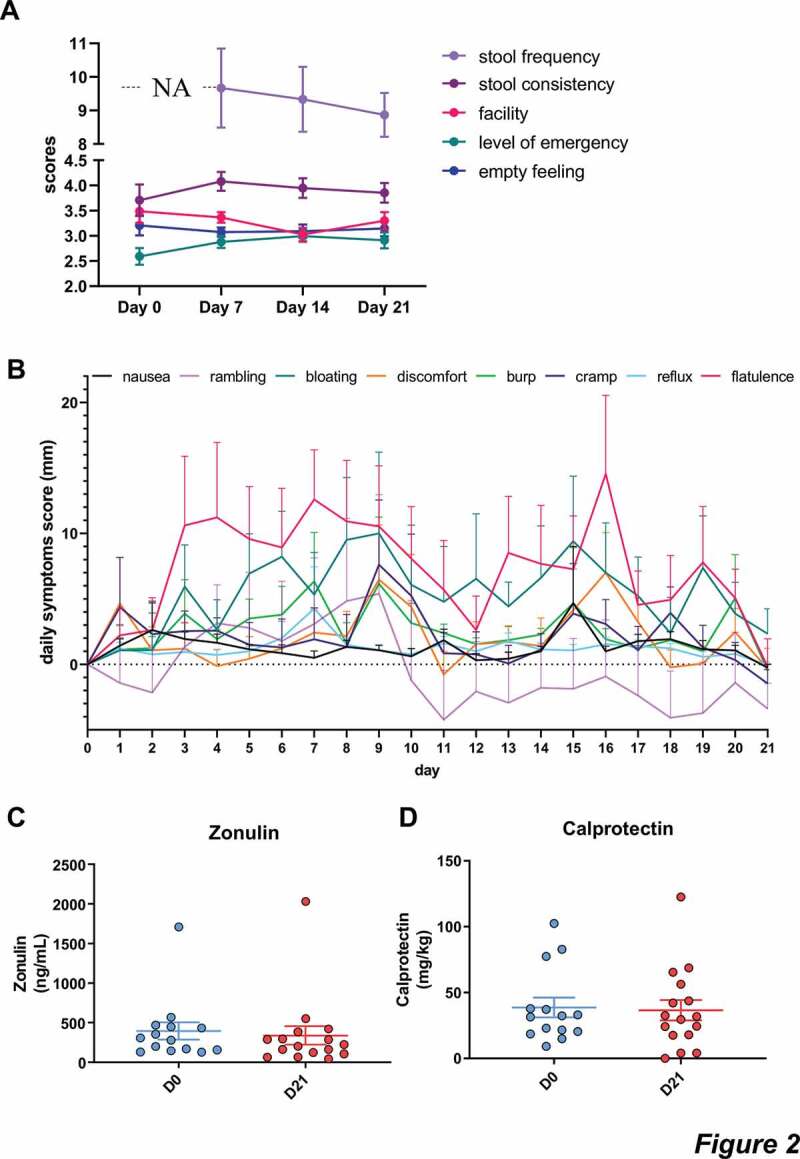
Figure 2.

Gastrointestinal tolerance.
a: results of the Bristol stool scale (stool frequency and consistency) and the defecation questionnaire measuring urgency, facility and emptying. Data are expressed as mean±sem. NA: non applicable. Mixed-effects analysis were performed for detecting the treatment effect throughout the intervention. Mixed-effects analysis showed a significant effect of treatment on the evolution of level of emergency, and defecation facility, during the intervention (level of emergency, p < .05). b: gastrointestinal symptoms including discomfort, nausea, flatulence, cramp, burp, bloating, rumbling and reflux. Mixed-effects analysis were performed for detecting the treatment effect throughout the intervention. No significant difference was observed for any symptoms. c-d: Fecal concentrations of zonulin and calprotectin.
