
Figure 5.
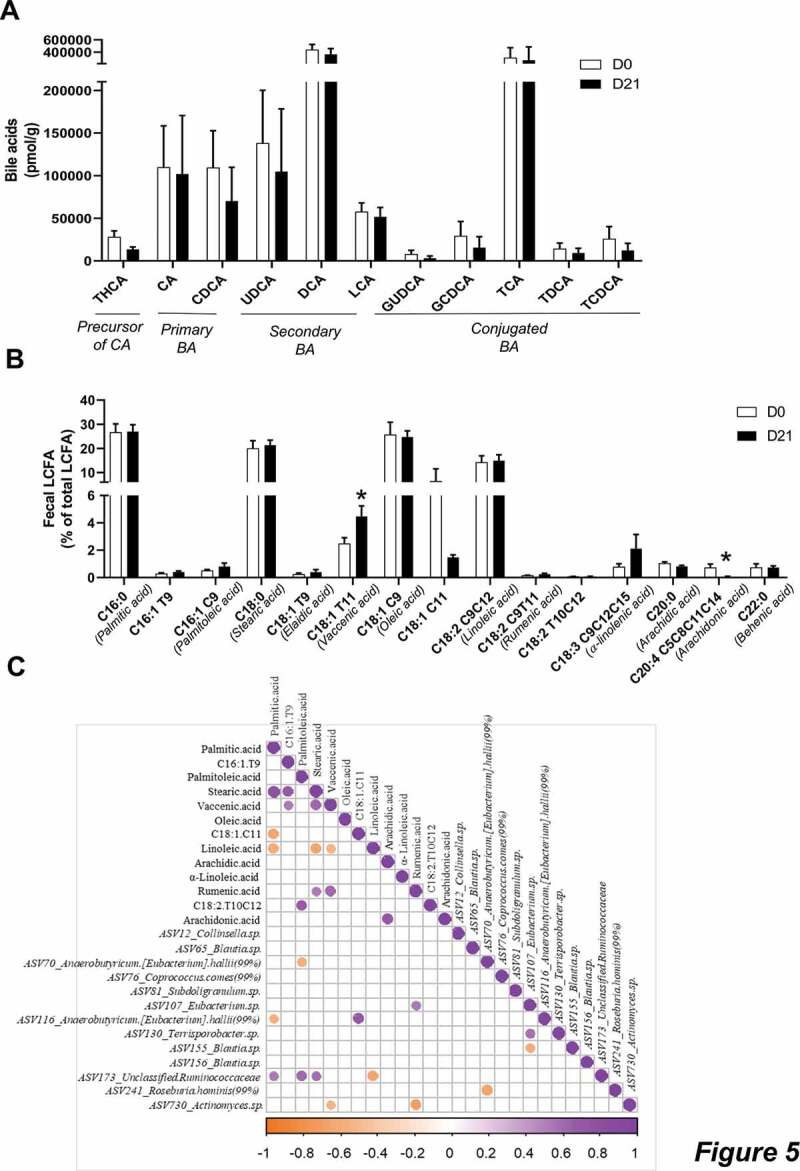
CG increased the fecal concentrations of vaccenic acid.
a: Data are normalized to the mass of dry matter and are expressed as mean ± sem of the ratio between the signal of the analyte and the signal of its internal standard. b: Percentage of LCFA/total LCFA detected in the feces of human volunteers. Data are expressed as mean ± sem. Wilcoxon matched-pairs test between D0 and D21. *p < .05. c: Heatmap of Spearman’s correlations between the ASV significantly modified by CG treatment and the fecal concentrations of LCFA. The presence of circle means that the correlation is significant, p < .05.