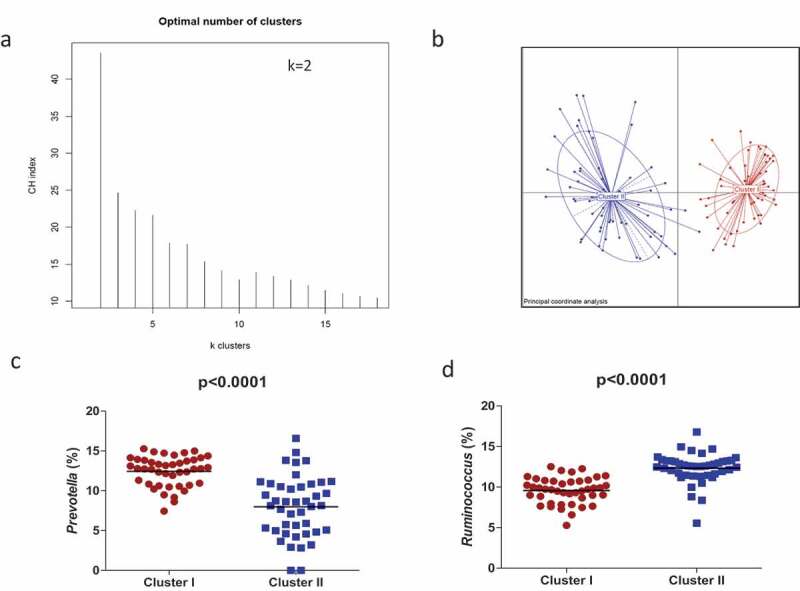
Figure 1.

Maternal gut microbial clusters and representative genus. The PAM method shows that participants are separated into two clusters (a) and Principal Component Analysis (PCA) showed the two differential clusters (b); the relative abundances (%) of the representative bacterial genus in each cluster are represented, Prevotella in Cluster I (red circles) (c) and Ruminococcus in Cluster II (blue squares) (d). The middle line represents the media of all values.
