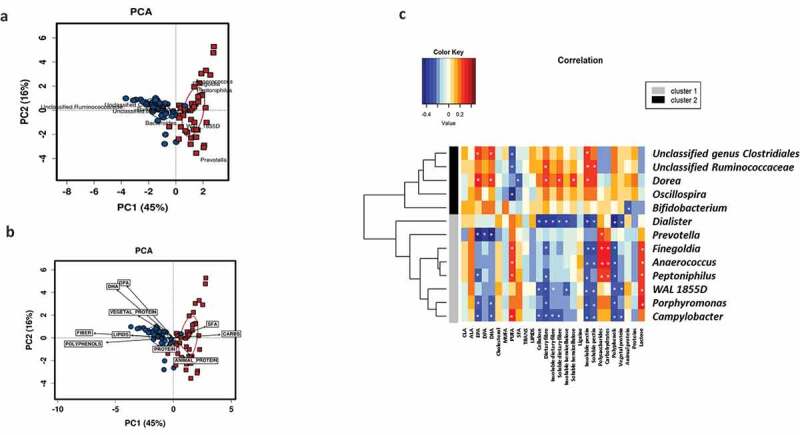
Figure 3.

Maternal diet shapes the microbial clusters. Biplots from the principal component analysis (PCA) showed that maternal microbiota clusters were associated with specific microbial genus (a) and nutrients (b). Cluster I = red squares and Cluster II = blue circles. Pearson correlations between nutrient intake during pregnancy and bacterial abundance at the genus level at delivery (c). Association of dietary components with the most abundant bacterial group of each cluster. Significant correlations (p < .05) were marked by an asterisk (*). Blue squares marked the negative correlations, whereas the red color showed positive correlations as measured by Pearson’s correlations.
