
Figure 5.
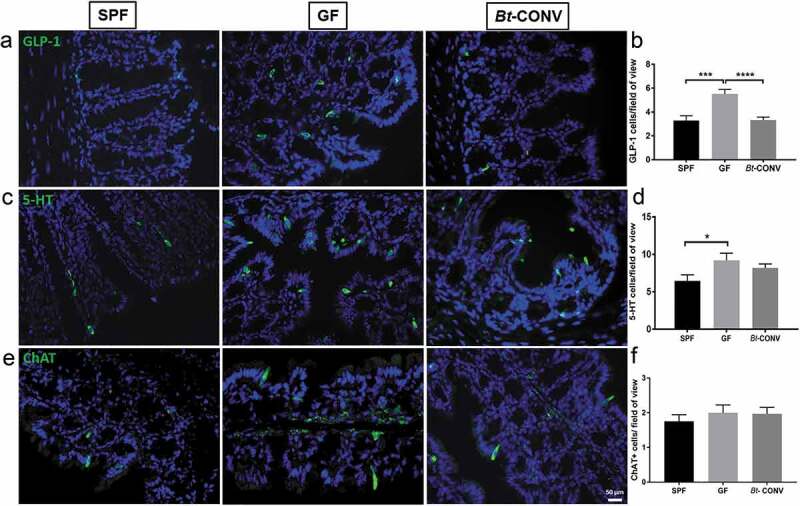
Bt-CONV specifically normalizes L-cells only.
GLP-1 found in L cells is increased in GF conditions; however, this is restored by Bt-CONV back to SPF levels (a and b). 5-HT containing EC cells is similarly increased in GF mice, however, unaltered in Bt-CONV (c and d). ChAT containing tuft cells is unchanged across all groups (e and f). N = 3–5. Error bars show SEM, and significance is p < .05 as denoted by *. Scale bar = 50 μm.