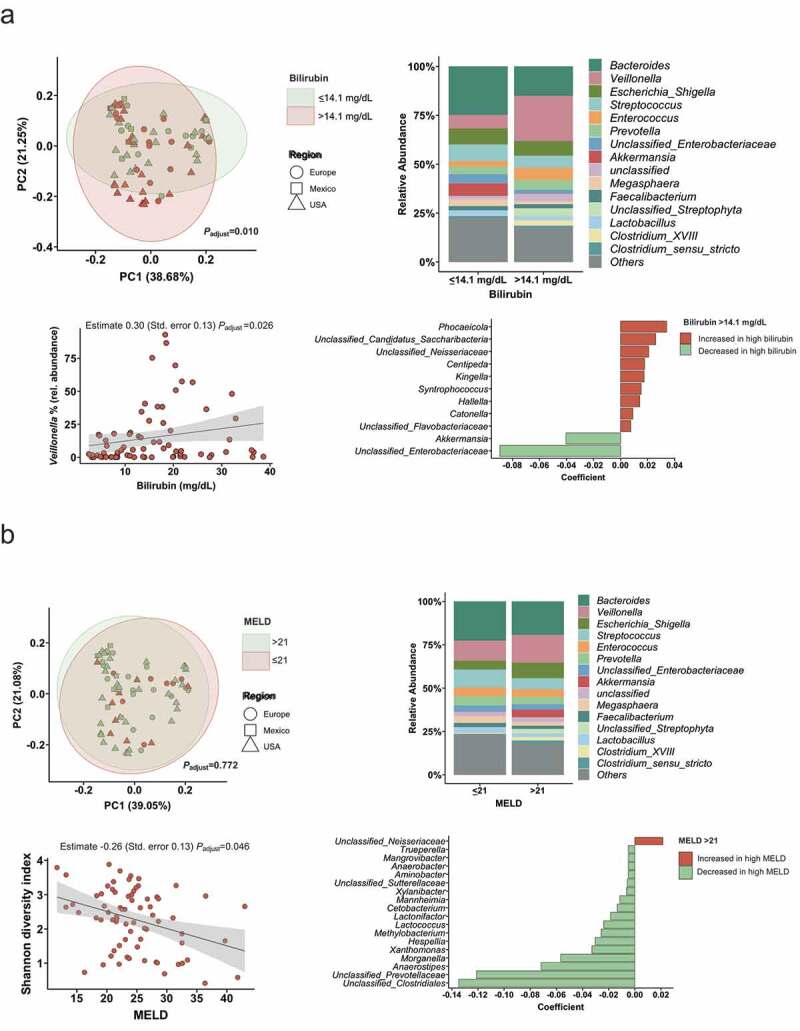
Figure 2.

Association of disease severity with the intestinal microbiota.
(A) The upper left panel shows the principal coordinate analysis, that was used to show ß-diversity between the groups based on the abundance of 323 bacterial taxa at the genus level. The axes represent the two most discriminating axes using the Bray–Curtis distance metric. The P value was determined by permutational multivariate analysis of variance (PERMANOVA). The upper right graph demonstrates the mean relative abundance of sequence reads in each genus for each group (alcoholic hepatitis patients were grouped according to the median bilirubin level of 14.1 mg/dl in the cohort). The lower left panel shows the Spearman correlation between bilirubin levels and the relative abundance of Veillonella. The lower right panel shows MaAsLin (Multivariate analysis by linear models), including all 323 bacterial taxa on genus level. Bilirubin >14.1 mg/dl: n = 37; <14.1 or equal: n = 36. (B) The upper left panel shows the principal coordinate analysis, that was used to show ß-diversity between the groups based on the abundance of 323 bacterial taxa at the genus level. Alcoholic hepatitis patients were grouped according to a MELD score higher or lower/equal than 21. The axes represent the two most discriminating axes using the Bray–Curtis distance metric. The P value was determined by PERMANOVA. The upper right graph demonstrates the mean relative abundance of sequence reads in each genus for each group. The lower left panel shows the negative Spearman correlation between the Shannon index and the MELD score. The lower right panel shows MaAsLin results. All analyses except for the upper right panels were adjusted for treatment with antibiotics, steroids, pentoxifylline, ethnicity, and the center origin. MELD >21 mg/dl: n = 54; <21 or equal: n = 18.
