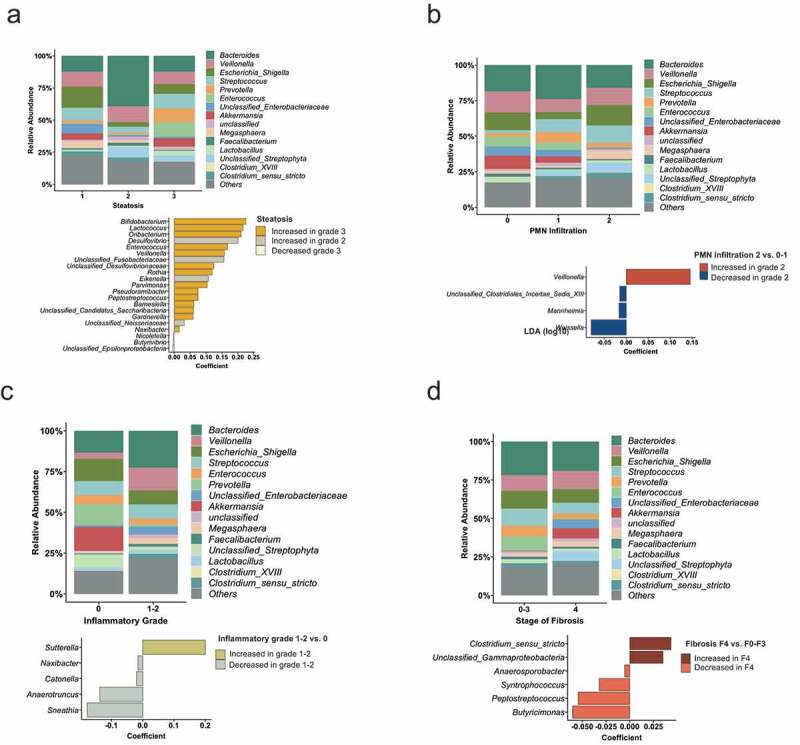
Figure 5.

Liver histology features associated with the intestinal microbiota.
(A) Mean relative abundance of sequence reads in each genus for each group (alcoholic hepatitis patients were grouped according to steatosis on liver histology (1, n = 16; 2, n = 12, 3, n = 13)). The lower panel shows MaAsLin (Multivariate analysis by linear models) results, including all 323 bacterial taxa on genus level. (B) Alcoholic hepatitis patients were grouped according to PMN (polymorphonuclear) infiltration on liver histology (1, n = 9; 2, n = 18, 3, n = 14). Mean relative abundance of sequence reads and MaAsLin results, including all 323 bacterial taxa on genus level. (C) Mean relative abundance of sequence reads in each genus for each group (alcoholic hepatitis patients were grouped according to the inflammatory grade on liver histology (0, n = 11; 1–2, n = 30)) and MaAsLin results. (D) Mean relative abundance of sequence reads in each genus for each group (alcoholic hepatitis patients were grouped according to the liver fibrosis stage on liver histology (0–3, n = 16; 4, n = 25)). The lower panel shows MaAsLin results including all 323 bacterial taxa.
