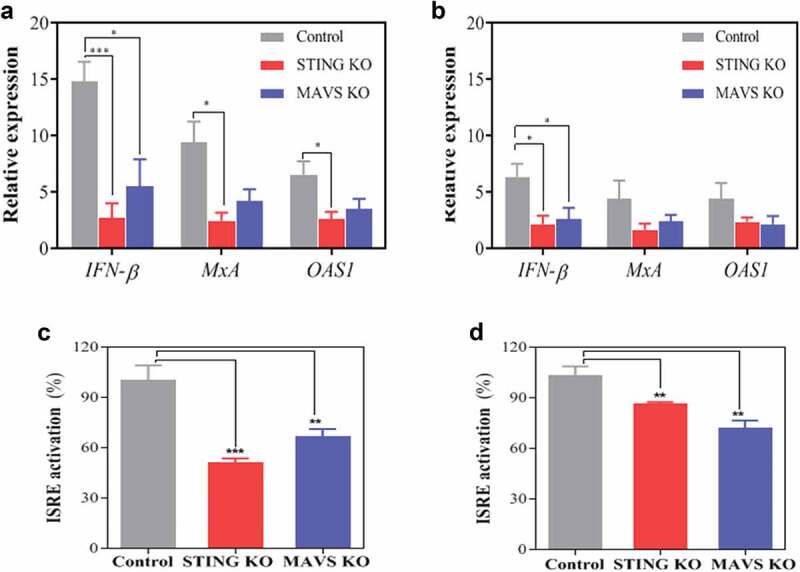
Figure 7.

The IFN-I response of macrophages to Lactobacillus plantarum (LP) and Pediococcus pentosaceus (PP) is dependent on STING and MAVS. (a, b) Level of relative mRNA expression of IFN-β, MxA and OAS1 in IFIT1-GLuc THP-1 macrophages (control, gray) and their corresponding knockouts (KO) for STING (red) and MAVS (blue) after exposure to (a) LP or (b) PP for 8 h at a ratio of 1 macrophage per 25 viable bacteria. The relative expression of each gene is presented as a fold induction following normalization with the internal control gene TBP and nonstimulated THP-1 macrophages. A comparative statistical analysis was carried out between the control and the knockout cells using the Student’s t-test (*p < .05, ***p < .005). (C, D) ISRE activation from supernatants obtained from IFIT1-GLuc THP-1 macrophages (control, gray) and their corresponding knockouts (KO) for STING (red) and MAVS (blue) after exposure to (c) LP or (PP) for 24 h at a ratio of 1 macrophage per 25 viable bacteria. The ISRE activation for each cell line was calculated as a fold increase using a pISRE-FLuc/RLuc reporter cell line after 10 h of supernatant exposure and then indicated as a percentage relative to control. A comparative statistical analysis was carried out between the control and the knockout cells using the Student’s t-test (**p < .01; ***p < .005).
