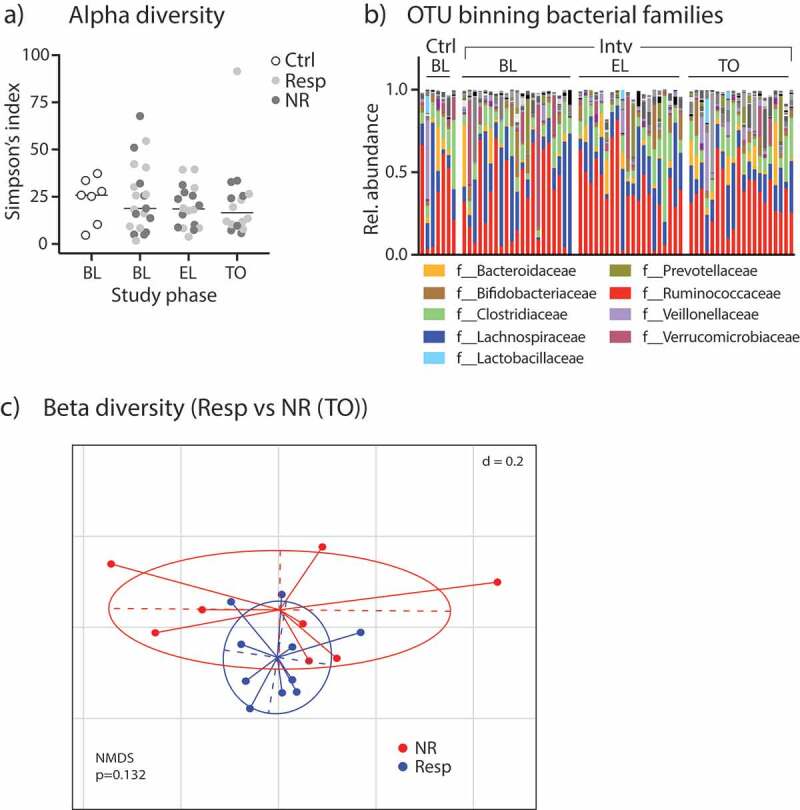
Figure 2.

Fecal microbiome analyzes by 16S rRNA amplicon sequencing. (A) Alpha-diversity levels shown as Simpson’s index in control participants and patients of the intervention group (split into Resp vs. NR) during different study periods. (B) Relative abundances of bacterial families in study participants. (C) Non-metric multidimensional-scaling (NMDS) plot of fecal microbiota beta-diversity indices (generalized UniFrac distances) from Resp vs NR at TO; p-value obtained by PERMANOVA.
