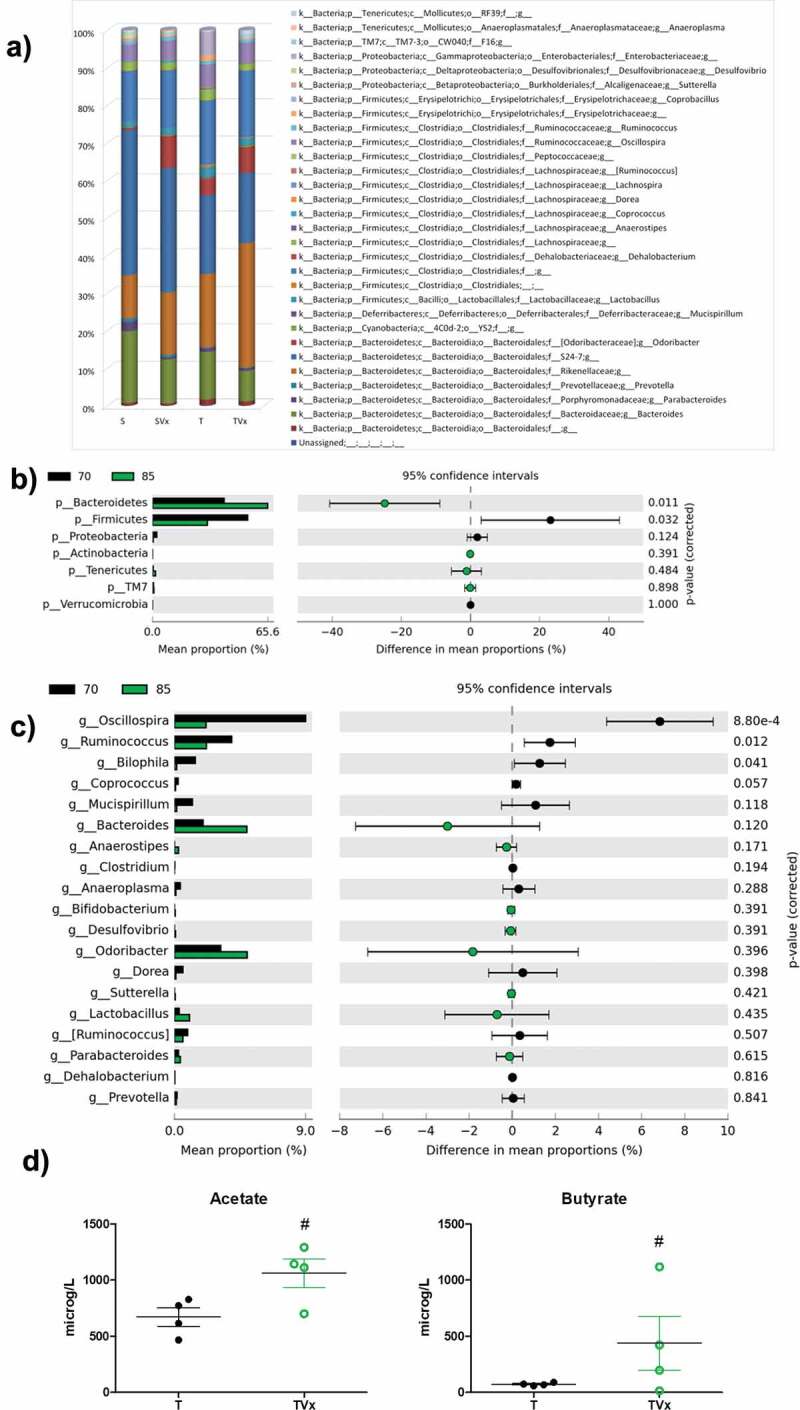
Figure 2.

Changes in gut microbiota population after Vivomixx treatment. Fecal pellets were collected freshly from each mouse before and after probiotic treatment. A) Stacked bar charts of the relative abundance of main bacterial communities, at genus level, present in the different experimental groups. Extended error bar plots, at phylum (b) and genus level (c), shows the differences in the mean proportions of bacterial taxa in TMEV mice before (black) and after treatment (green). Corrected p-values are shown on the right. D) Quantification of the plasma levels of acetate and butyrate. The data are presented as the means ± SEM: ***p < .001 vs. S; ##p < .01 vs T; n = 5 mice/group.
