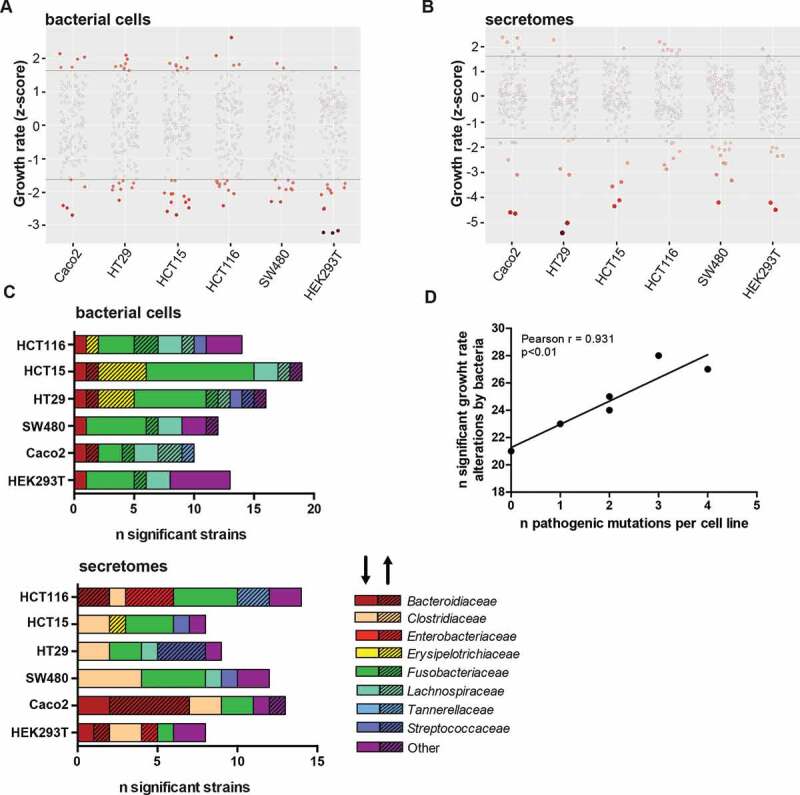
Figure 2.

Growth rate alterations of cells lines upon incubation with bacterial cells and secretomes. Distribution plots illustrating effects of (a) bacterial cells and (b) secretomes on cell lines. Negative numbers indicate growth inhibition whereas positive numbers show growth enhancement. The color intensity of the circles represents significance of the effect on growth. (c) Overview of the number of bacterial cells and secretomes significantly enhancing or inhibiting cell growth per tested cell line, sorted by bacterial family. The shading of the bar (arrow pointing upwards) highlights enhancing and unshaded bar (arrow pointing downwards) highlights inhibiting strains. (d) Correlation of number of strains significantly altering growth rates to the number of pathogenic mutations present in cell lines. HEK293T, Caco-2, HT29, SW480, HCT116, and HCT15 were shown to possess 0, 1, 2, 2, 3, and 4 pathogenic mutations, respectively.
