
Figure 4.
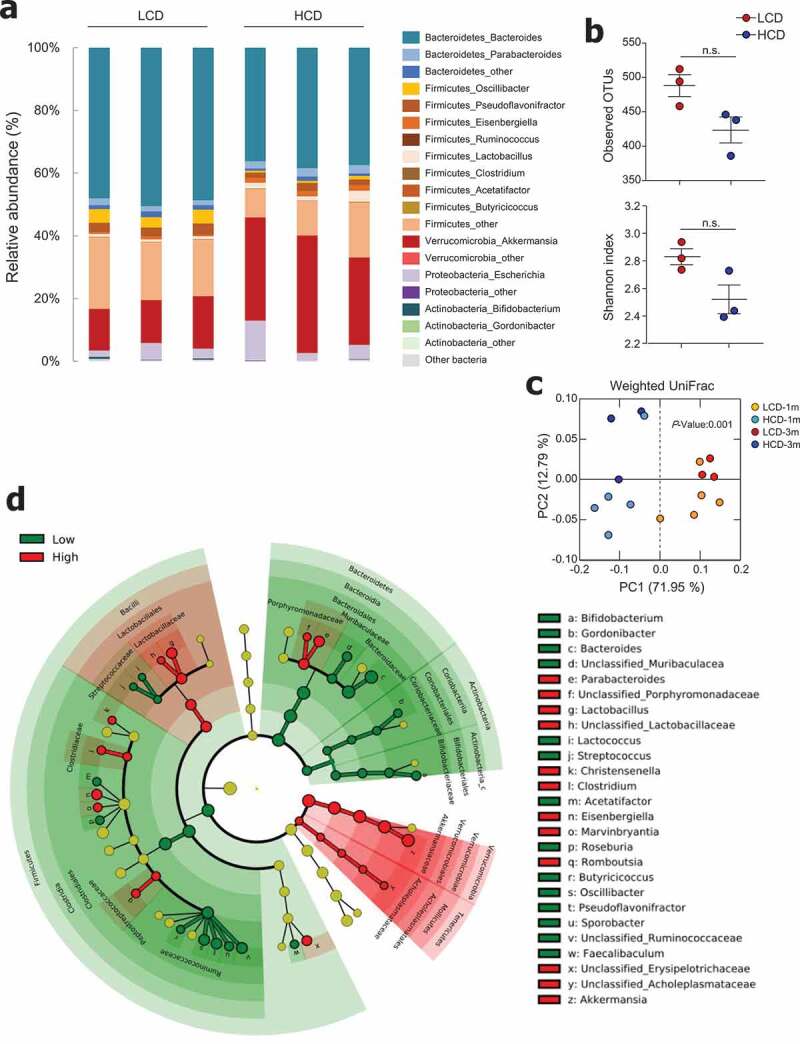
Cellulose consumption changed gut microbiota composition. (a) Relative abundance of operational taxonomic units (OTUs) at genus levels detected by 16s rDNA sequencing in feces of mice fed LCD or HCD for 12 weeks (n = 3/group). (b) Observed OTUs and the Shannon diversity index were assessed. (c) Principal coordinate analysis (PCoA) of weighted UniFrac distances was conducted for fecal microbial communities from mice fed LCD or HCD for 4 weeks (n = 5/group) and 12 weeks (n = 3/group). (d) Cladogram, generated from LEfSe analysis, shows differentially abundant taxa of fecal microbiota (at genus level) that were enriched in LCD- and HCD-fed mice. Dot size is proportional to taxon abundance. Statistical analyses were conducted using Student’s t-test. n.s., not significant (P > .05).