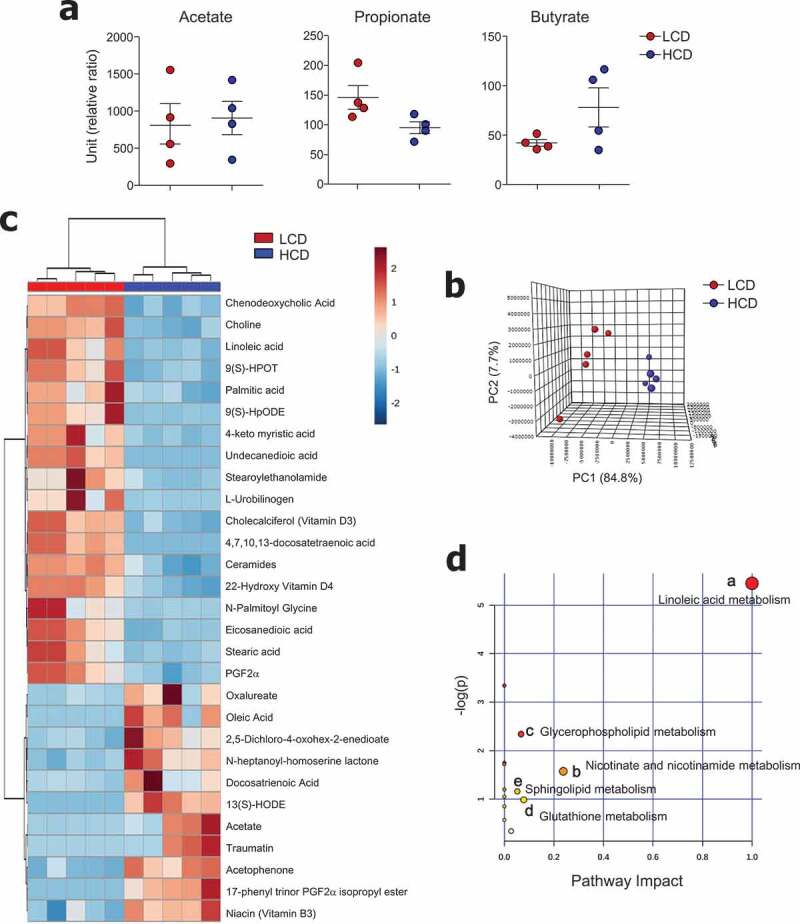
Figure 5.

Metabolic profiles were altered by cellulose intake. (a) Levels of SCFA and (b-d) non-targeted metabolomics of cecal contents from LCD- and HCD-fed mice analyzed using LC-MS (n = 5/group). (b) Principal component analysis (PCA) plot showing clustering between groups. (c) Differentially enriched metabolites were selected and clustered in a heatmap. (d) Pathway analysis summary of significant changes in metabolite levels between LCD- and HCD-fed mice (obtained by MetaboAnalyst 4.0) shows pathway impact score from pathway topology analysis on x-axis and negative log (p-values) from pathway enrichment analysis on y-axis. Statistical analyses were conducted using Student’s t-test.
