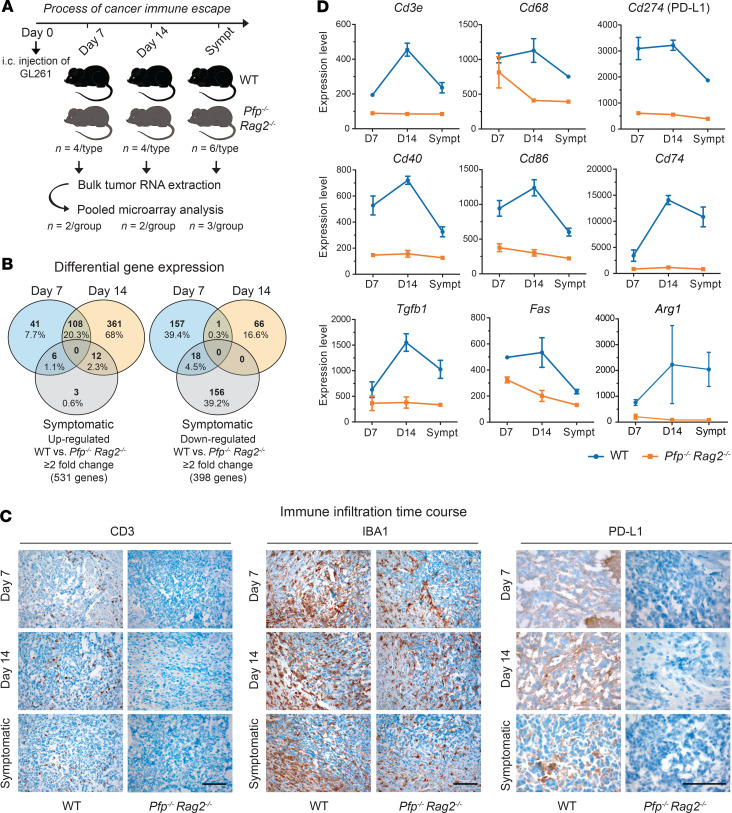
Figure 2. Gene regulation during tumor evolution.
(A) Workflow of GL261 tumor analysis. RNA from 2× 2 mice per mouse type (days 7 and 14) or 3× 2 mice per mouse type (symptomatic endpoint [Sympt]) was pooled for expression profiling by Illumina WG-6 v2.0 arrays. i.c., intracerebral. (B) Venn diagrams of genes over- and underexpressed in WT versus Pfp–/– Rag2–/– mice. (C) Immunohistochemistry for CD3, IBA1, and PD-L1. Scale bars: 100 μm. (D) Expression values of selected immune-related genes over time. Data are presented as mean ± SEM; day 7, n = 2; day 14, n = 2; symptomatic, n = 3.

