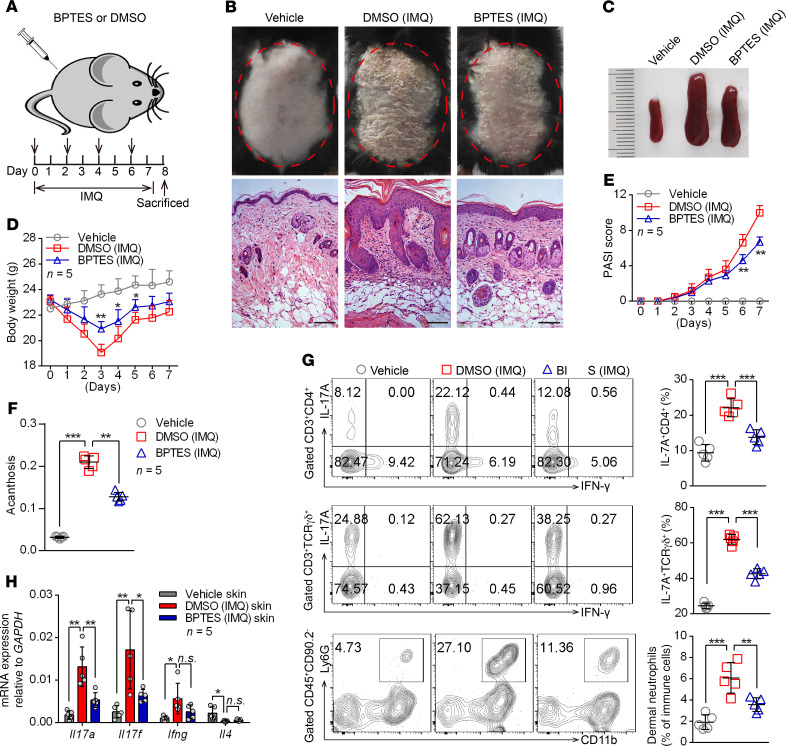
Figure 3. Administration of GLS1 inhibitor ameliorates the pathological phenotype of IMQ-induced psoriasis-like mice.
(A) Schematic diagram of intraperitoneal administration of BPTES (100 μg/dose administration) or DMSO (5% DMSO in 200 μL PBS) on days 0, 2, 4, and 6 during the application of IMQ or not for 7 consecutive days. (B–F) Clinical manifestations and H&E staining of the back skin (B) (scale bars: 100 μm), splenomegaly (C), body weight (D), PASI scores (E), and acanthosis (F). n = 5. (G) Flow cytometry and statistical analysis of the percentage of IL-17A+ in dermal CD4+ T cells (gated on CD3+CD4+ cells) and γδ T cells (gated on CD3+TCR γδ+ cells) and of neutrophils in dermal CD45+CD90.2– lymphocytes (n = 5). (H) Relative mRNA expression of Il17a, Il17f, Ifng, and Il4 in skin lesions (n = 5). Data are presented as the mean ± SD and represent 1 of 3 independent experiments with consistent results. One-way ANOVA with Tukey’s multiple comparisons test (D–H) was used to determine statistical significance (*P < 0.05, **P < 0.01, ***P < 0.001).

