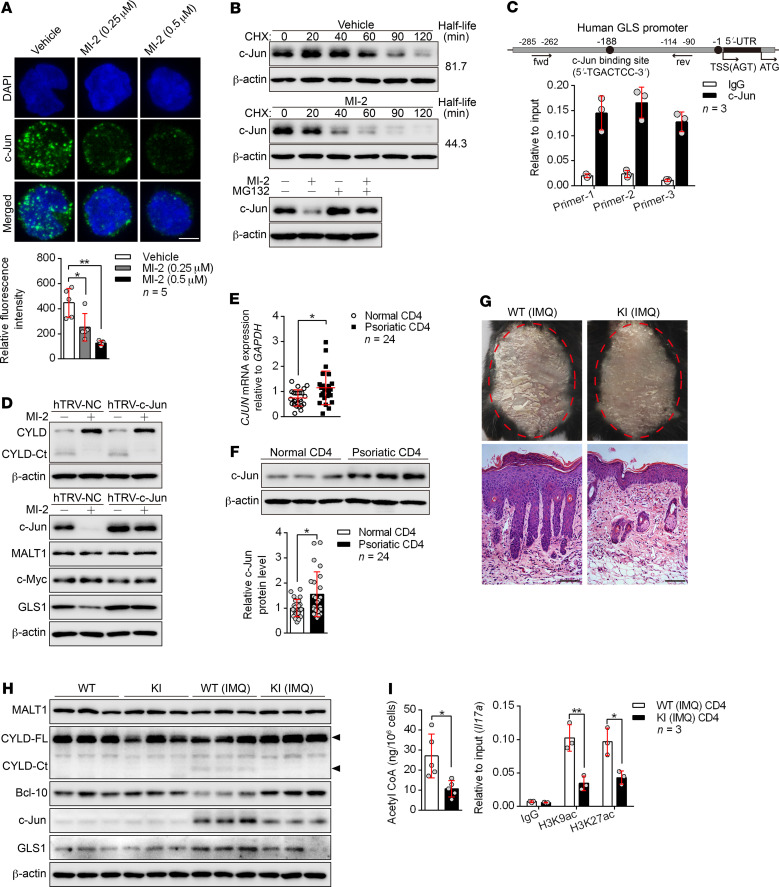
Figure 7. MALT1 protease promotes GLS1-mediated glutaminolysis via c-Jun.
(A) Human naive CD4+ T cells were polarized into Th17 cells with the indicated treatment for 5 days. Confocal microscopy of cells stained with c-Jun antibody (green) and the DNA-binding dye DAPI (blue). Scale bars: 5 μm. Graph shows relative intensity of c-Jun expression in (n = 5). (B) Representative blots for c-Jun expression in cells from A that were restimulated with anti-CD3 and anti-CD28 antibodies followed by cycloheximide (CHX) treatment at the indicated time points (upper panel), or that were treated with MG132 or not for 12 hours. (C) ChIP for the c-Jun binding site on the proximal region of the GLS promoter (n = 3). fwd, forward; rev, reverse; TSS, transcription start site. (D) Cells in A were transduced with a concentrated retrovirus carrying hTRV–c-Jun or control (hTRV-NC). Representative blots for MALT1 protease activity following restimulation with anti-CD3 and anti-CD28 antibodies and expression of c-Jun, MALT1, c-Myc, and GLS1. (E and F) Relative mRNA (E) (n = 24) and protein (F) (n = 3 of a total of 24 samples) levels of c-Jun in psoriatic CD4+ T cells. (G–I) WT or MALT1 protease-deficient (KI) mice were painted with IMQ cream for 7 consecutive days. Clinical manifestations and H&E staining of the back skin (G) (scale bars: 100 μm). Representative blots for MALT1 protease activity and GLS1 and c-Jun expression in splenic CD4+ T cells (H) (n = 3). Acetyl-CoA concentration (n = 5) and histone acetylation of Il17a promoter regions (n = 3) in splenic CD4+ T cells (I). Data are presented as the mean ± SD and represent 1 of at least 2 independent experiments with consistent results. One-way ANOVA with Tukey’s multiple comparisons test (A) or 2-tailed, unpaired Student’s t test (E, F, and I) was used to determine statistical significance. (*P < 0.05, **P < 0.01).

