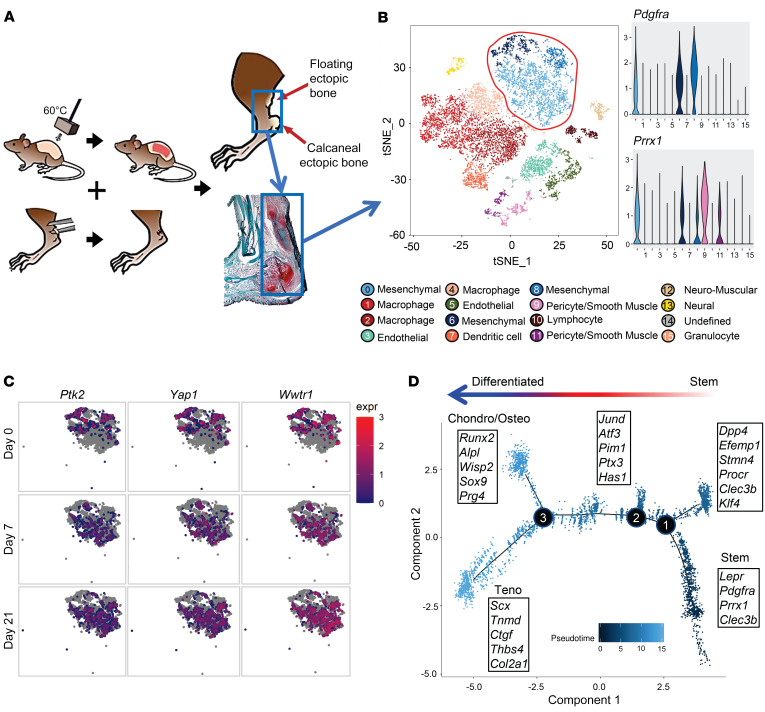
Figure 1. MPCs at the extremity injury site demonstrate increased mechanotransductive genes before aberrant cell fate change.
(A) Schematic of burn/tenotomy (BT) injury model denoting where the cells were harvested (blue box). (B) Canonical correlation analysis of the HO site defines 16 clusters, including 3 MPC subsets based on expression of Pdgfra, Prrx1, and Clec3b. (C) Feature plot of the MPC clusters displaying expression of Ptk2, Wwtr1, and Yap1 across the different time points of the canonical analysis. (D) Trajectory analysis of gene expression changes in cells across pseudotime.

