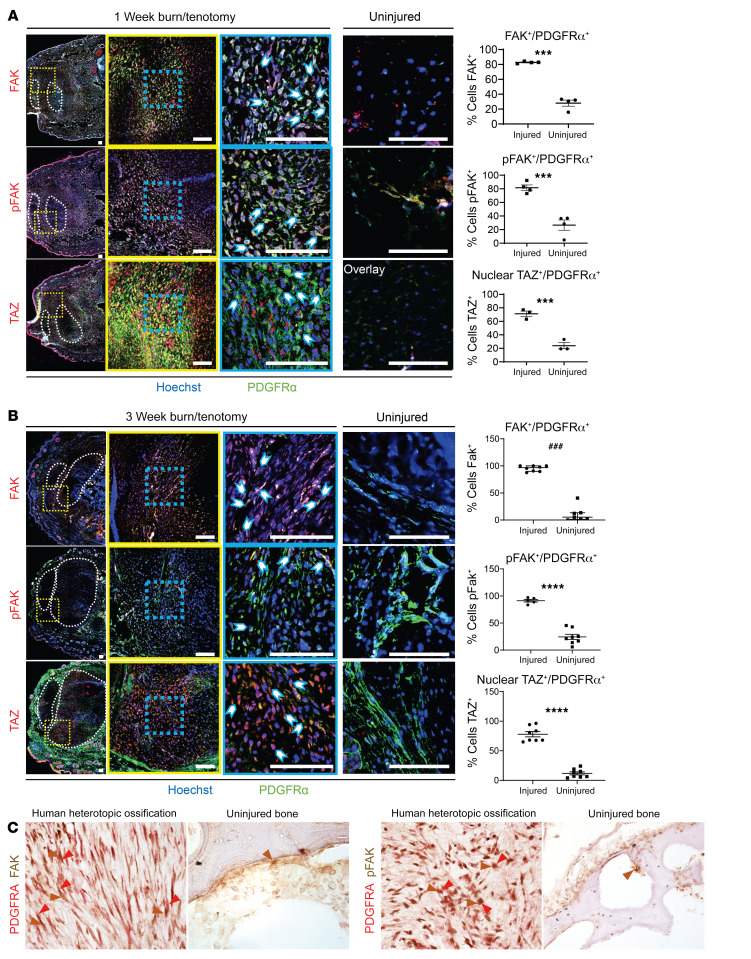
Figure 2. MPCs at the extremity injury site demonstrate increased mechanotransductive signaling before aberrant cell fate change.
(A) Confocal microscopy images of injured and uninjured mouse hind limbs immunologically stained with anti-PDGFRα and anti-FAK, anti-pFAK, or anti-TAZ after 1 week BT injury compared with uninjured control. Nuclei are stained with Hoechst 33342. Tilescan images (left) of HO anlagen with tendon encircled by white dotted outline and red dotted square showing ×20 image (middle). Image overlay at ×20 magnification with individual channels (right). Blue-dotted square shows ×63 magnification. Image overlay at ×63 magnification with individual channels (right). Image overlay at ×20 magnification of uninjured mouse hind limb with individual channels (right). Quantification of ×63 magnification comparing number of PDGFRα+ cells expressing FAK, pFAK, and nuclear TAZ, respectively in injured and uninjured hind limbs by independent samples t test (n = 3/group, ***P < 0.001). (B) FAK, pFAK, and TAZ immunofluorescent stains at 3 weeks postinjury (n = 3–4/group) of injured and uninjured mouse hind limbs immunologically stained with anti-PDGFRα and anti-FAK, anti-pFAK, or anti-TAZ. Scale bars: 100 µm. ###P < 0.001, ****P < 0.0001. (C) Immunohistochemical stains of FAK, pFAK, and PDGFRα of human uninjured bone and HO. Original magnifications, left to right: ×40, ×20, ×40, and ×20.

