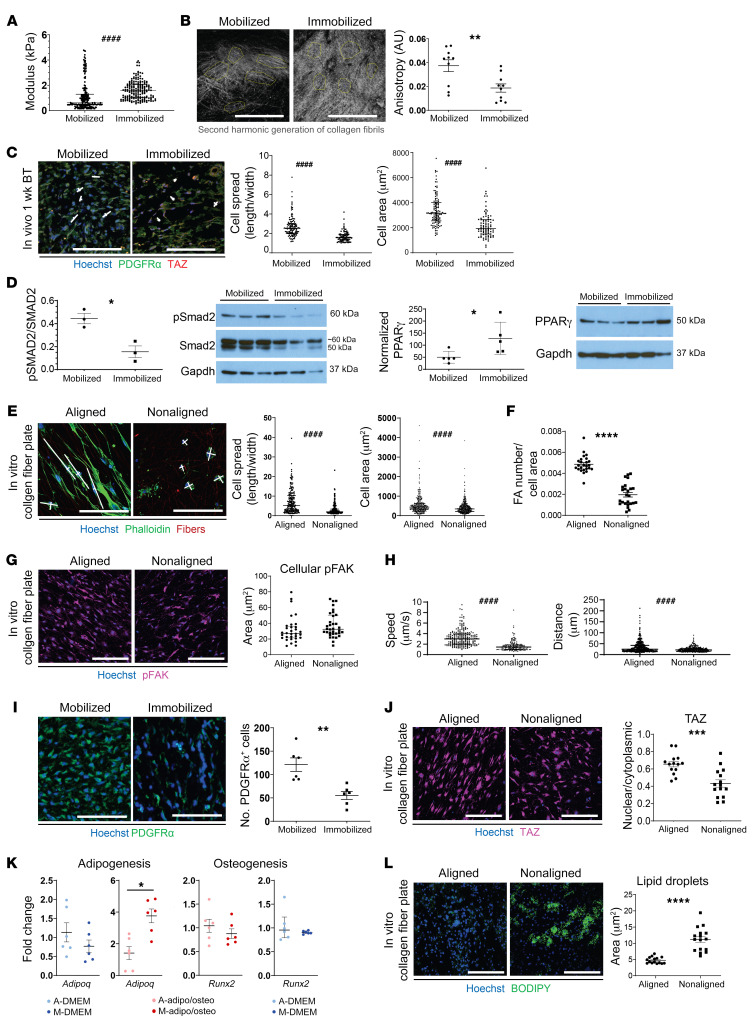
Figure 6. Immobilization alters the extracellular environment affecting MPCs.
(A) Elastic modulus at site of HO formation immobilized and mobilized mice 1 week after B/T as determined by atomic force microscopy. ####P < 0.0001. (B) Second harmonic generation of collagen fibrils at 1 week after injury with anisotropy quantification (right) (n = 2/group, **P < 0.01). (C) Confocal microscopy images of hind limb cross sections 1 week after injury with indicated antibodies and quantified for cell spread and area (right) (n = 3/group, ####P < 0.0001). (D) Western blots for pSMAD2, SMAD2, PPARγ, and GAPDH on whole-tissue lysate from 1-week post-B/T immobilized and mobilized mice. *P < 0.05. (E) Confocal microscopy images of LST cells on aligned (A) and nonaligned (NA) collagen fiber plates probed with indicated antibodies and quantified for cell spread and area (right) (n = 3/group, n = 5 roi/plate, ####P < 0.0001). (F) Quantification of focal adhesions normalized by cell area of LST cells in aligned and nonaligned plates (****P < 0.0001) (G) Confocal microscopy images of LST cells on aligned and nonaligned collagen fiber plates quantified for cellular pFAK (10–12 cells/n, n = 3/group). (H) Quantification of speed and distance traveled by LSTs on aligned and nonaligned plates: Supplemental Video 1 (####P < 0.0001). (I) Confocal microscopy images of hind limb cross sections at 1 week after injury quantified for number for number of PDGFRα+ cells. **P < 0.01. (J) Confocal microscopy images of LST cells on aligned and nonaligned collagen fiber plates probed for TAZ and quantified for nuclear/cytoplasmic ratio (right) (4–5 images/n, n = 3/group, ***P = 0.0003). (K) Effects of aligned (A) or nonaligned (N) electrospun collagen I coated fibers on Runx2 and Adipoq expression in either DMEM or mixed medium (n = 3/group, *P < 0.05, A vs. N within media type). (L) Confocal microscopy images of LST cells on aligned and nonaligned collagen fiber plates in mixed medium for 7 days and subsequently stained with BODIPY and lipid droplets quantified (right) (5–6 images/n, n = 3/group, ****P < 0.0001). *Calculated using Student’s t test, #Calculated using Mann-Whitney U test. Scale bars: 100 µm.

